In order to compute a one-way analysis of variance with MAXQDA Stats, select Compare Groups > Analysis of Variance in the main menu. A window appears that allows you to select several dependent variables and one factor as an independent variable.

Variables can be selected in several ways:
- Double-click on a variable.
- Drag and drop the variable into the right window pane.
- Select one or multiple variables with the mouse by holding the Ctrl/Cmd key then dragging the selection into the right window pane with the mouse, or click the blue arrow in the middle of the window.
To integrate code frequencies per document as dependent variables or as a factor, switch to the “Codes” tab and select the desired codes. (This option is available only if MAXQDA Stats was launched with the data of a MAXQDA project).
In order to integrate only those cases that contain variables with a valid value select Exclude cases listwise.
Results table
After starting the calculation by clicking OK an analysis of variance is performed for each selected dependent variable. The following results table appears for the first dependent variable. Use the blue arrows and drop down menu on the top of the window to switch to results tables for the other dependent variables.

The number of valid and missing cases for each calculated variance analysis is displayed in the upper right corner. The results table includes all the major results of the variance analysis.
- The column “sum of squares” contains the sum of squares between groups and within groups.
- The column “df” provides information on the number of degrees of freedom and allows conclusions on the number of groups that are defined by the factor. The example shows 3 +1 = 4 groups.
- The “mean squares” can be calculated by dividing the sum of squares by the degrees of freedom. The ratio of mean squares in turn results in the “F-value” whose probability of occurrence can be computed by using the F-distribution and finds expression in the “p-value”.
- “Eta-squared” is a measure of effect size and signifies the variance explained by the factor. The value is between 0 and 1 and can be interpreted as a percentage.
Testing the homogeneity of variances
A prerequisite for the calculation of a variance analysis is the homogeneity of variance within the single factor levels. This can be tested with the Levene test, the results are displayed in the lower part of the table.
Overview of Toolbar Functions
In the upper section of the results window two toolbars are located, which contain the following important functions:
![]() Table view / Chart view – switches between table and chart view for means.
Table view / Chart view – switches between table and chart view for means.
![]() Previous/Next – using the blue arrow or the selection list, switch between the results table for the dependent variables.
Previous/Next – using the blue arrow or the selection list, switch between the results table for the dependent variables.
![]() Refresh – Recalls the dialog window for selecting variables for analysis of variance.
Refresh – Recalls the dialog window for selecting variables for analysis of variance.
![]() Insert into output viewer – inserts the currently displayed table or chart in the Output Viewer.
Insert into output viewer – inserts the currently displayed table or chart in the Output Viewer.
![]() Insert all into output viewer – inserts all created tables or charts in the Output Viewer.
Insert all into output viewer – inserts all created tables or charts in the Output Viewer.
![]() Copy to clipboard – copies the current table, highlighted area in the table, or chart in the clipboard, for example for insertion into Word.
Copy to clipboard – copies the current table, highlighted area in the table, or chart in the clipboard, for example for insertion into Word.
![]() Print – prints the currently displayed table or chart.
Print – prints the currently displayed table or chart.
![]() Export – exports the currently displayed table in Excel format, website (HTML) format or RTF format for Word and other word processing programs; exports the currently displayed chart in PNG, SVG or EMF (only Windows) format.
Export – exports the currently displayed table in Excel format, website (HTML) format or RTF format for Word and other word processing programs; exports the currently displayed chart in PNG, SVG or EMF (only Windows) format.
![]() Descriptive statistics – opens a window containing descriptive values for the groups build by the factor.
Descriptive statistics – opens a window containing descriptive values for the groups build by the factor.
![]() Undo changes – step-by-step resetting of changes to a table (deletion of rows).
Undo changes – step-by-step resetting of changes to a table (deletion of rows).
![]() Redo – step-by-step restoring of changes to a table.
Redo – step-by-step restoring of changes to a table.
Display descriptive statistics
If you want to display important characteristic values for each factor level click on the icon Descriptive statistics ![]() . A table appears containing information for each factor level and the total number of cases.
. A table appears containing information for each factor level and the total number of cases.
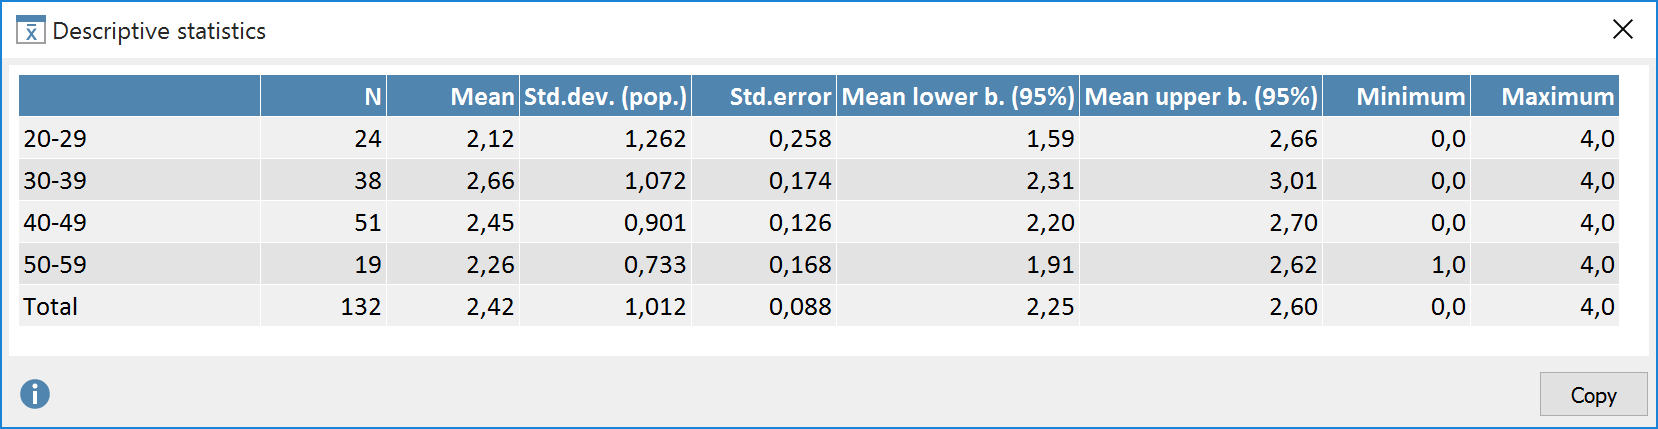
- Column “N” shows the number of valid values for each factor level.
- Column “Mean lower bound (95%)” contains the lower value of the confidence interval on the mean.
Transfer results table to the Output Viewer
After the tables have been created, they can be transferred to the Output Viewer from which they can later be exported together:
- Click the Insert into output viewer
 icon to transfer the currently displayed results table to the Output Viewer.
 - Click the Insert all result tables into output viewer icon to transfer all created tables to the Output Viewer at once.
MAXQDA Stats will ask if you also wish to include descriptive statistics for the factor groups. If you agree, an additional table will be displayed below the results table.

Export and print results table
Several options for exporting and printing the currently displayed results table are available using the following symbols:
![]() Copy to clipboard – copies the entire table or selection to the clipboard, for example in order to paste it directly into Word.
Copy to clipboard – copies the entire table or selection to the clipboard, for example in order to paste it directly into Word.
![]() Print – starts the print process and displays a print preview, in which the settings such as margins, orientation, headers and footers can be applied.
Print – starts the print process and displays a print preview, in which the settings such as margins, orientation, headers and footers can be applied.
![]() Export – exports the table in Excel format, website (HTML) format or RTF format for Word and other word processing programs.
Export – exports the table in Excel format, website (HTML) format or RTF format for Word and other word processing programs.
Display means as chart
In order to display a chart of the means of the single factor groups click the icon ![]() Chart view in the results table.
Chart view in the results table.

You can customize the design and view of the chart by using the icons in the toolbar above the chart as well as double-clicking and right-clicking the elements of the chart. The chart’s size automatically adjusts to the window size. Enlarge the window in order to receive a larger chart.
Mean charts can be transferred to the Output Viewer for later export. In order to do so, use the following icons.
![]() Insert chart into output viewer, to insert only the current display
Insert chart into output viewer, to insert only the current display
![]() Insert all charts into output viewer, to insert mean charts for all created result tables at the same time.
Insert all charts into output viewer, to insert mean charts for all created result tables at the same time.
To export or print a chart directly, you can use the usual icons in the top right of the window:
![]() Copy to clipboard,
Copy to clipboard, ![]() Print and
Print and ![]() Export.
Export.