The document portrait is the tool of your choice if you are looking for a quick visual impression of the way your documents have been coded. In this article we show you how to use the portrait – and which new options were introduced with MAXQDA 12.
To see at a glance what the codes in your documents are all about can be extremly helpful, especially when your are getting to know your data. Below we look at two document portraits in two different scenarios: First we want to visualize and compare guided interviews, secondly we want to visualize a focus group discussion, which is a new possibility in MAXQDA 12.
Visualize and compare documents
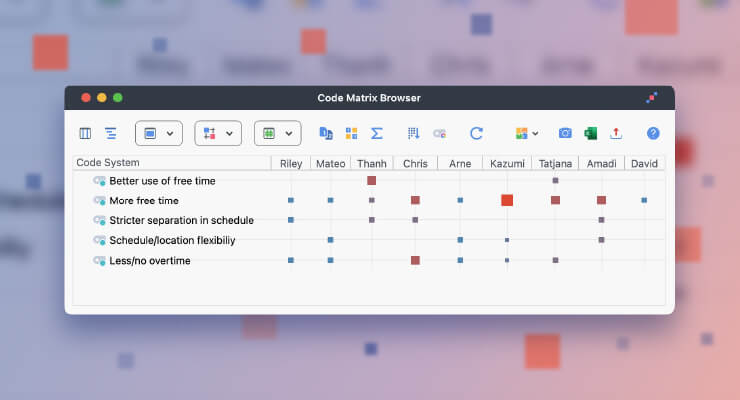
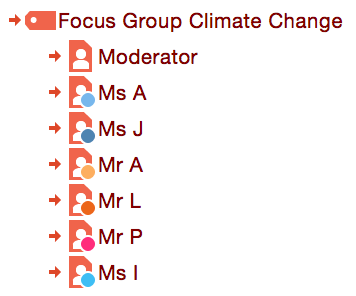
In our first scenario we want to compare two interviews that both discuss the issue of personal satisfaction in regard to different aspects of life (see picture). To accomplish that we start by assigning colors to the codes in question and activating them. We then right-click on the document we want to visualize, choose „Document Portrait“ and answer “yes” to the question if the portrait should only contain activated codes. (Alternativly we could click on “Visual Tools > Document Portrait” in the menu to display the portrait of the document currently shown in the document window.)
After doing that for both documents we have created the following two document portraits:
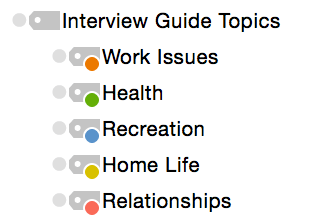
Topics of the codes visualized
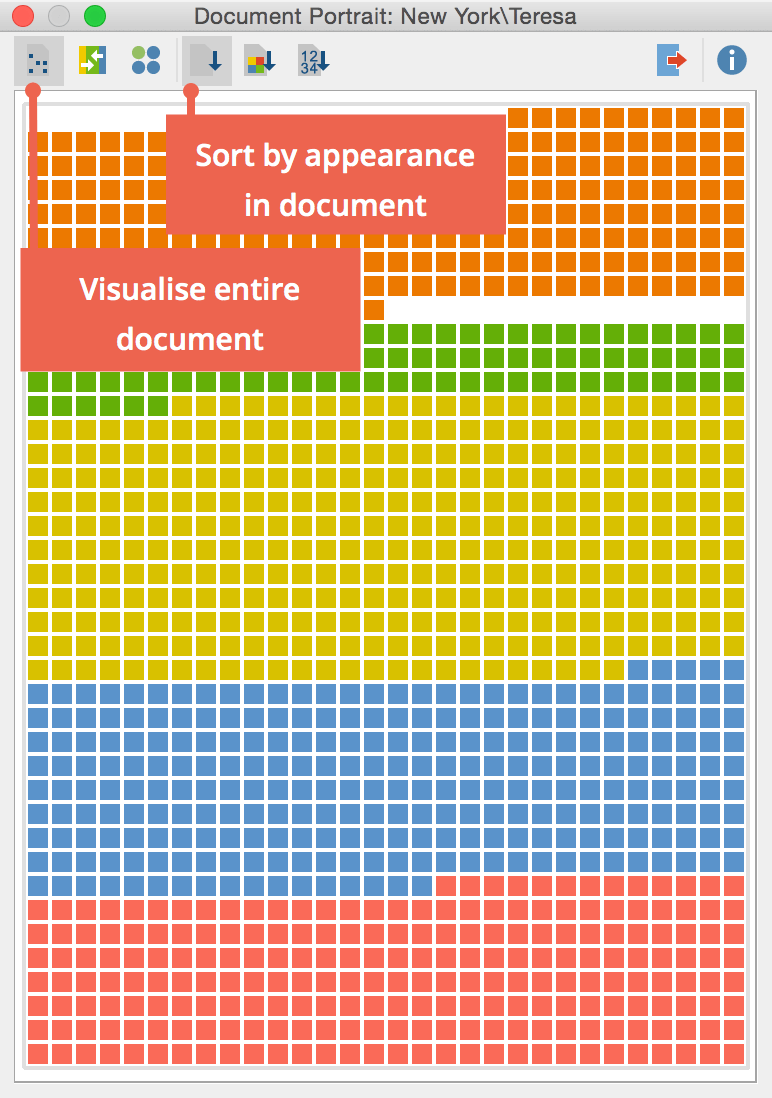
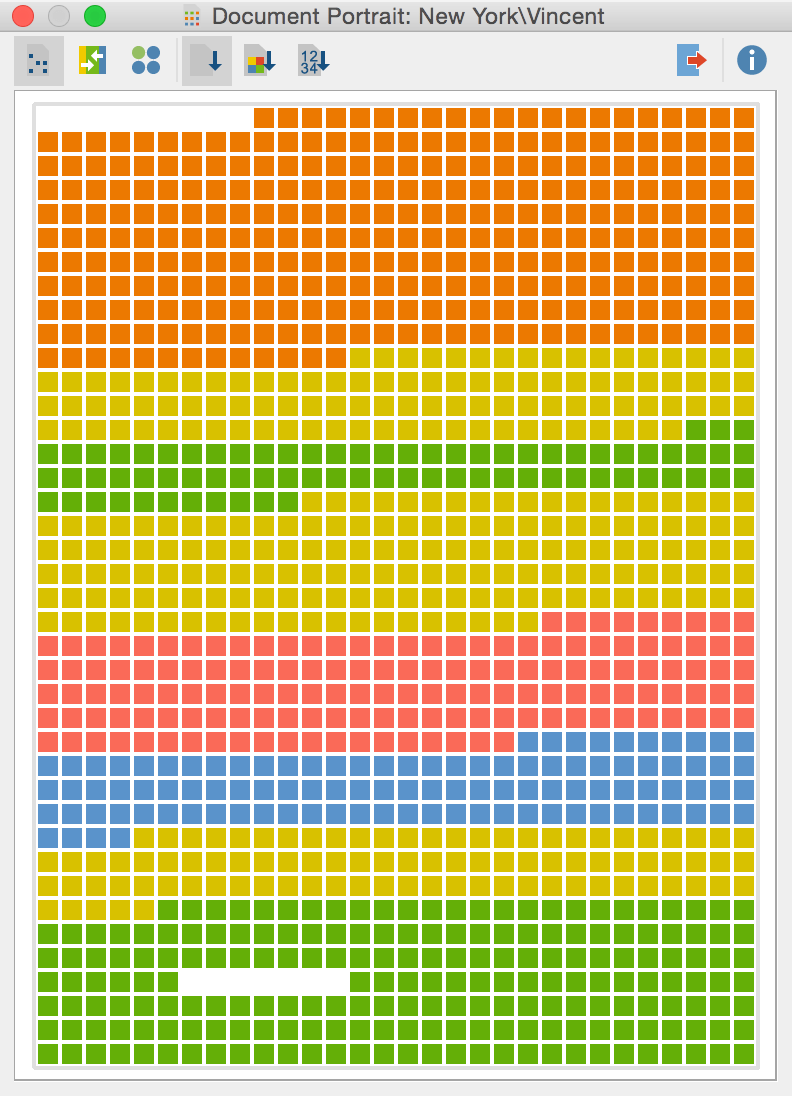
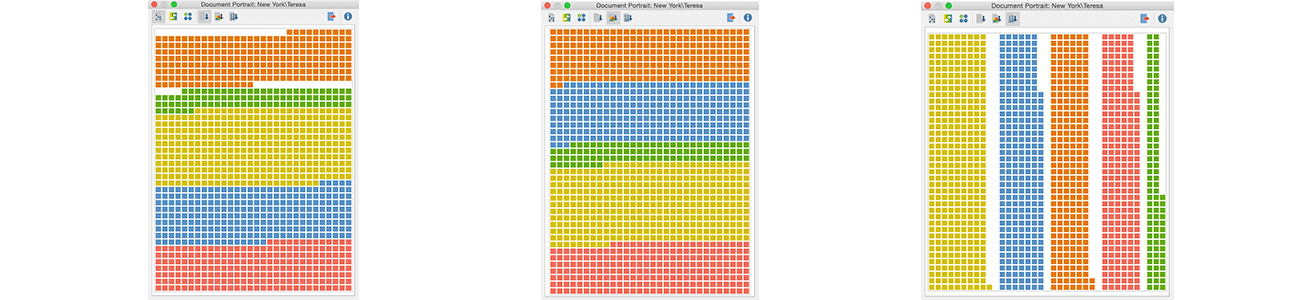
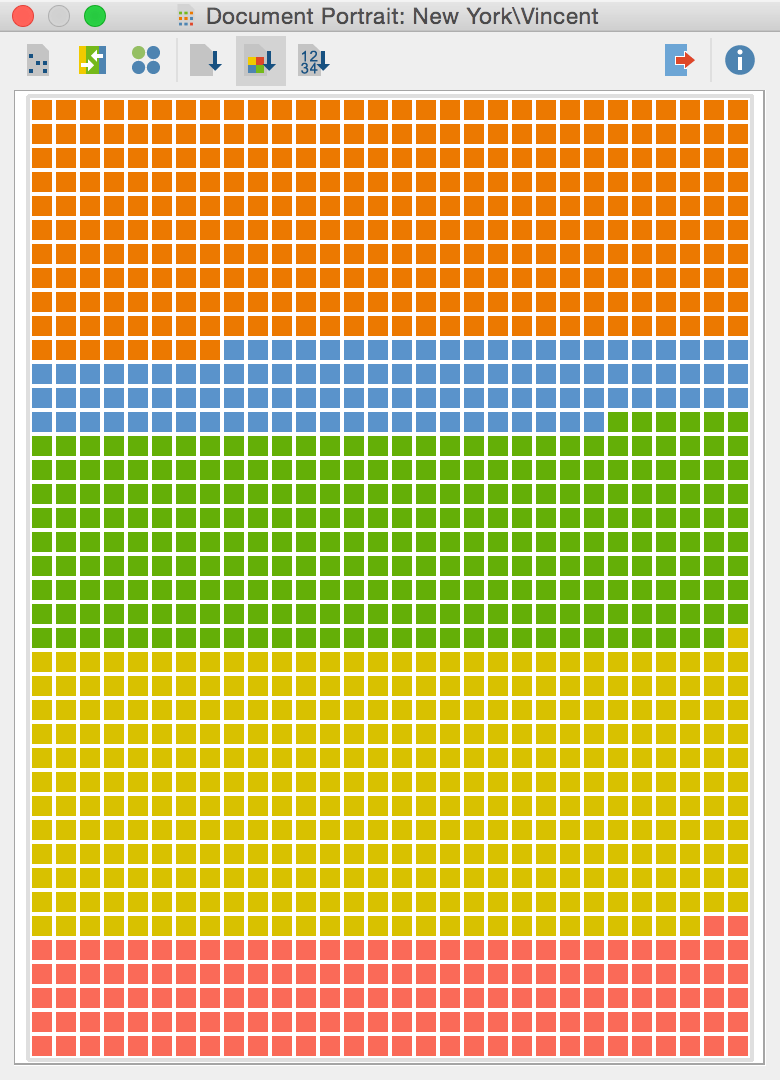
The document portrait visualizes segments by the color of the code they are coded with in the order of their appearance from top left to bottom right. At first sight we notice the difference in structure: the answers in the first interview have been given en bloc, while they are rather scattered in the second one.
Hint: Left-click on one of the tiles to jump to the correspondent segment in the document. Right-click to retrieve all coded segments coded with the same code color.
We can also estimate which topics have been discussed in length (yellow) and which have been discussed shorter (red). If we choose the option „Sort by frequency“ this estimation gets much more precise:
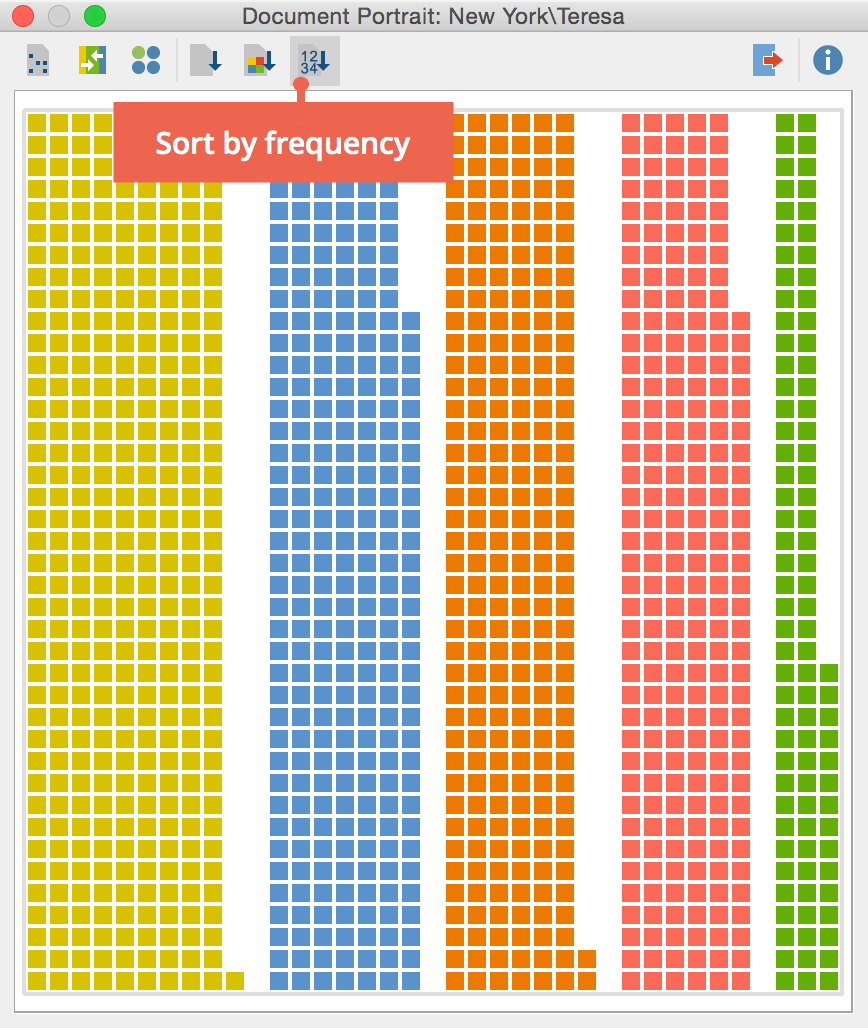
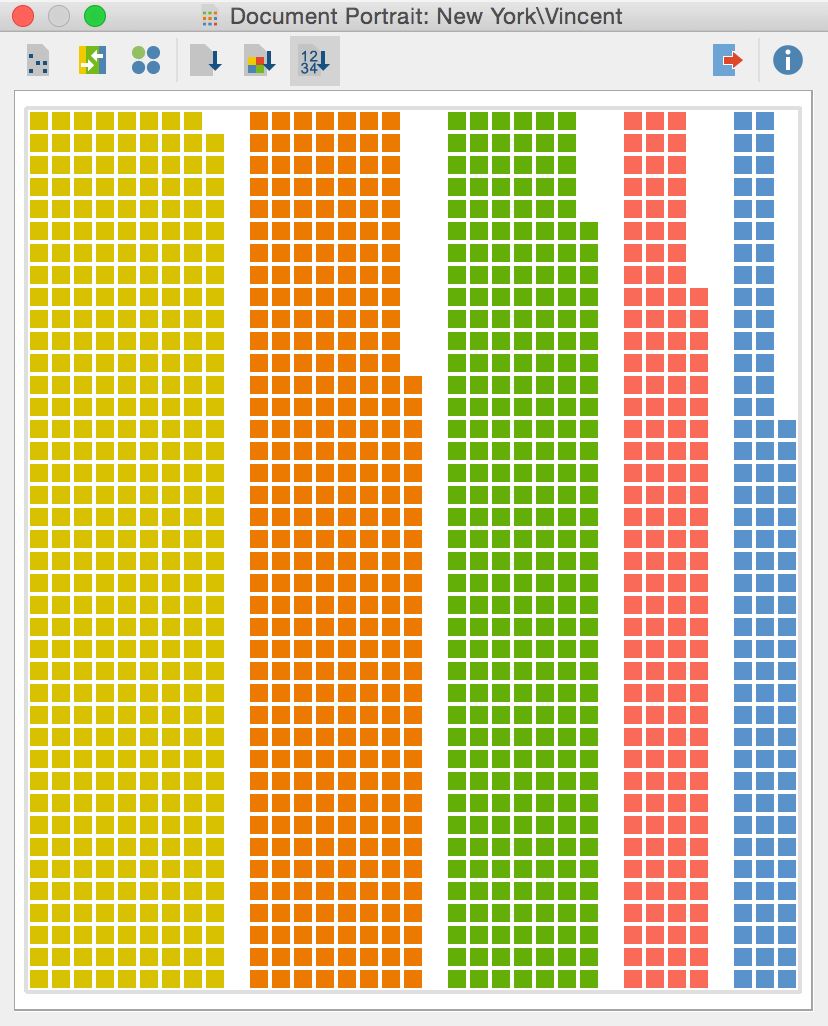
The segments that have been coded with codes of one and the same color are now sorted by frequency (descending from left to right). If we examine just one document this is all we need, but the fact that the colors are not shown in the same sequence is not yet ideal if we want to compare multiple documents. So to further facilitate the comparison we now click on „Sort by color“, which has the following effect:
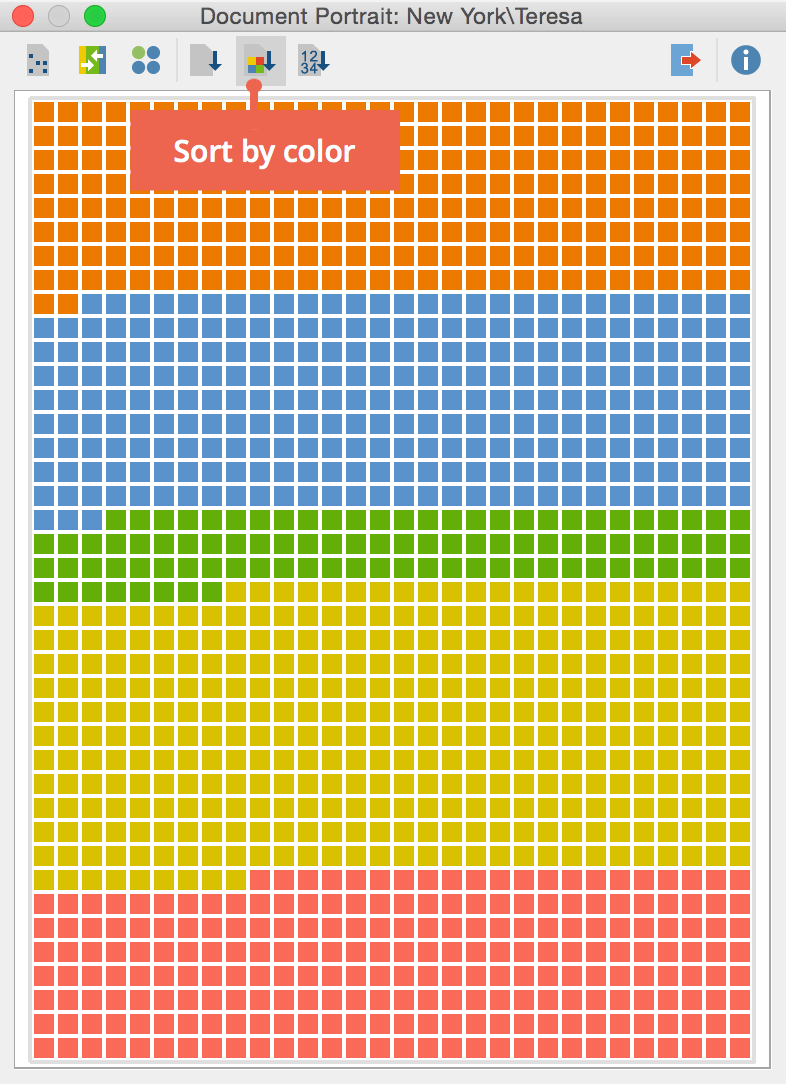
Now the segments are sorted by the (fixed) order of the chromatic circle, enabling us to easily compare the different segments. If we now click on „Export“ we can save the portraits as an image (.png) or vector graphics (.svg) and print them out or integrate them in our next presentation.
Visualize focus group discussions
When working with focus group transcripts we can also use the document portrait to visualize the course of a focus group discussion, and the intensity with which the different participants joined in. To do that we simply assign different colors to each of the focus group participants, then activate all of the focus group speakers and create a new document portrait.
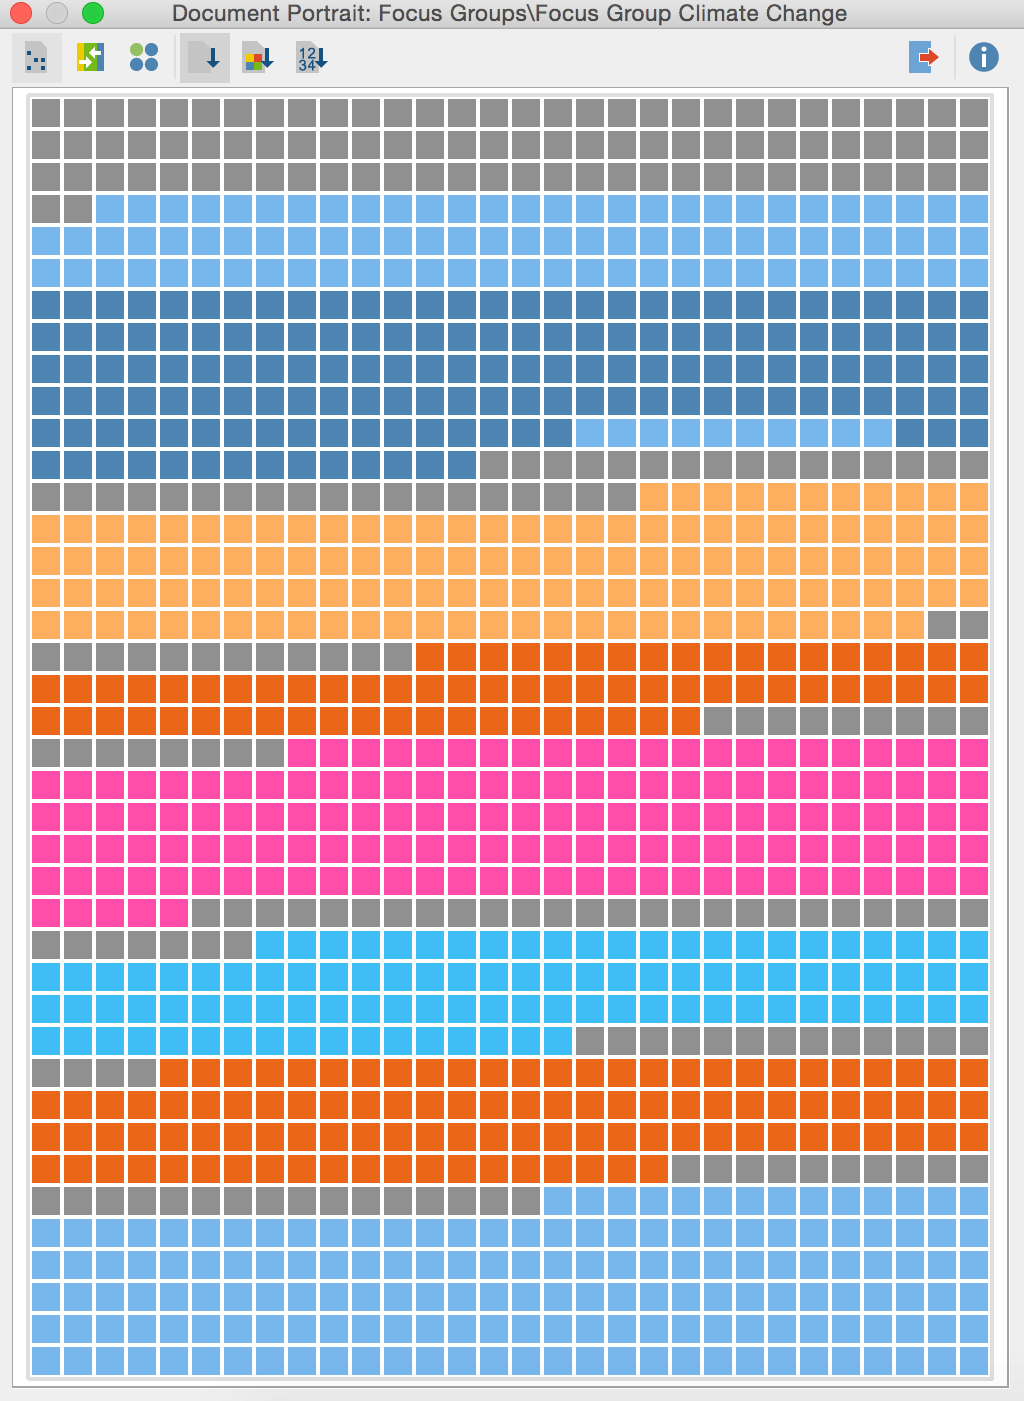
Progression of focus group discussion
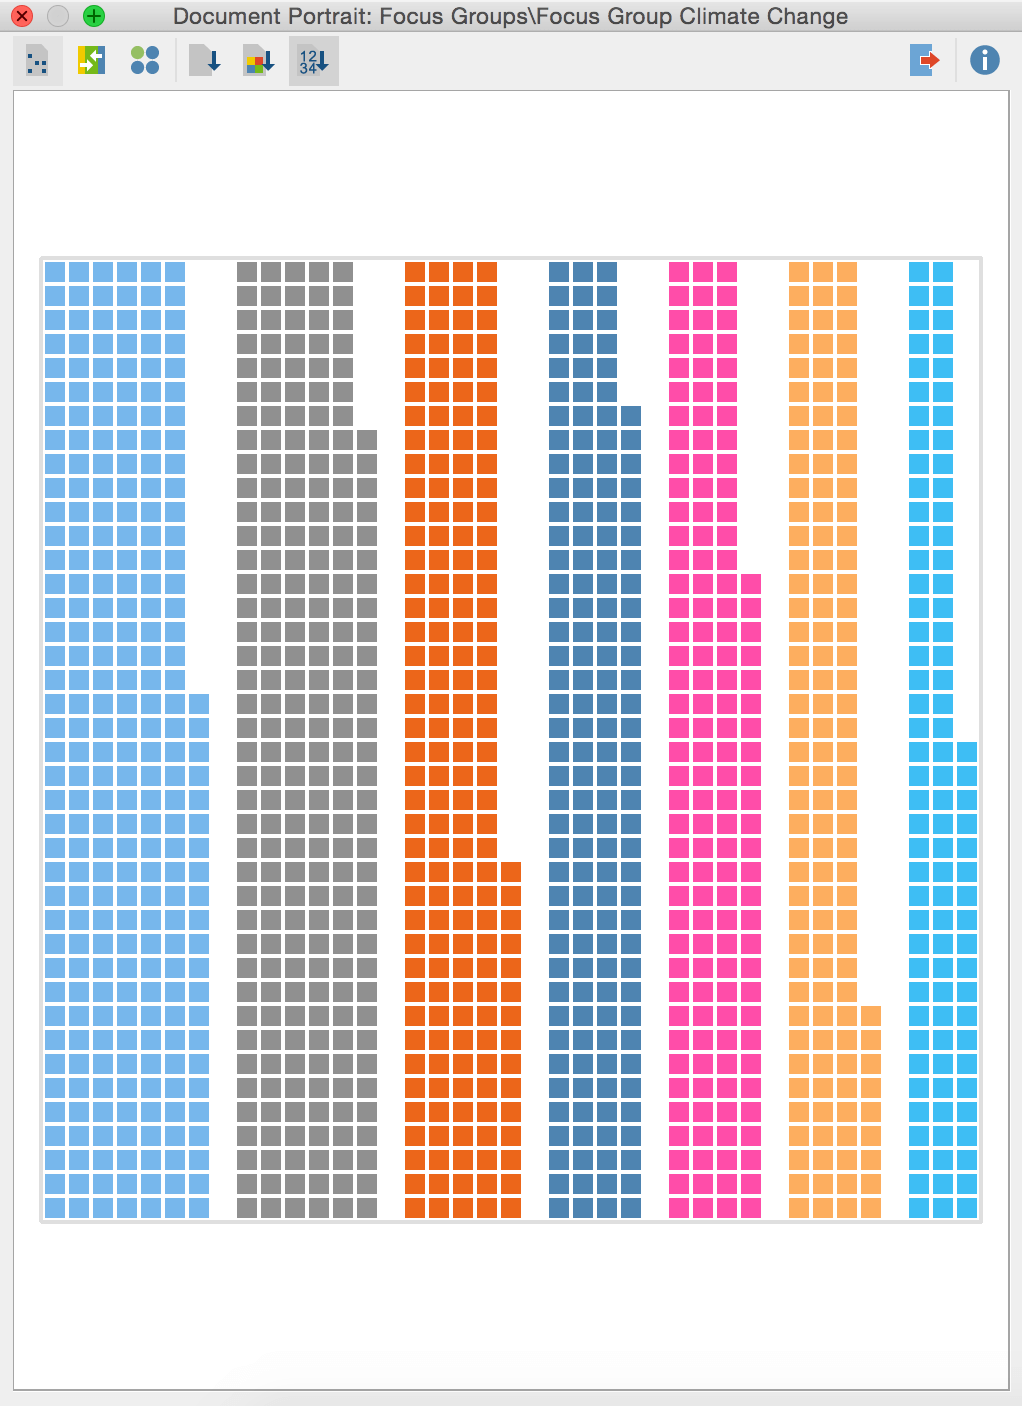
Comparison of each speakers contribution
In the first portrait we see the progression of the focus group discussion visualized. Noteworthy is the fact that the participants give each other space to make their points without interruption – the only interjection is being made by Miss A (light blue) while Miss J (dark blue) is speaking. Furthermore we see that while the contributions of the moderator (grey) are rather short in length, he does function as an intermediary who facilitates every turn-taking by the participants. The length of the total contribution of every participant is shown in the second portrait, pointing out that Miss A and the moderator contributed the most to the discussion, while Miss I was rather quiet.
Do you have any questions or comments about the document portrait? We look forward to your feedback — either here as a comment or in the MAXQDA user forum.