Guest post by Maria Freitas with the assistance of Francisco Freitas.
The usage of software in research is becoming commonplace thanks to the wide variety of possibilities and functions available. Software packages like MAXQDA are tools to assist research work, offering several options to handle important tasks like data management and analysis. In times of information overload, where data literacy and data skills are becoming mandatory, having a good command of or fluency in certain software packages is advisable. In that respect, this blog article describes a doctoral research project comprising the collection and analysis of news media data using MAXQDA 2020.
The doctoral work described here targeted the use of information sources within the sphere of cultural journalism in Portugal. The study’s main purpose was to frame this specific type of journalism, underlining how journalists working in this field relate themselves to the existing sources of information. Additionally, there was the attempt to understand how the sources of information influence the production of news articles in the cultural sections of two main Portuguese media daily newspapers – Diário de Notícias (DN) and Público.
The practical part of this research comprised a case study. MAXQDA proved to be very useful in terms of the analysis, more precisely as a valuable tool for a journalist’s inquiry within a sociological framework. By using MAXQDA, it was possible to complete the processing of quantitative data, whereas the in-depth reading and interpretation of the textual contents remained available throughout all the research stages. The latter has been pivotal to safeguard a more critical dimension in the analysis. The adoption of MAXQDA facilitated the exhaustive and systematic analysis of all the data gathered within the research. By data, we refer also to supplementary files to assist the analysis (e.g. reports, journal articles, web pages).
Data retrieval, analysis grid transposition and completion
Upon selection of the media outlets and the corresponding cultural sections, the data collection process began. The sampling comprised 28 releases, and a total of 81 news articles (N=81). All the files were imported to MAXQDA. Every article consisted of more than one page. A preliminary data verification was completed, after assessing all the procedures required and the best-practices in the field, including versioning and standard file formats (Corti et al., 2014). Every editorial piece was extracted and recorded in individual files using Portable Document Format (‘.PDF’). The original layout was preserved to facilitate reading, along with the existing metadata and the Optical Character Recognition (OCR). This last item is crucial to safeguard reading and hassle-free coding tasks within MAXQDA.
In the following screenshot, it is possible to see an example of pagination of a digital newspaper article:
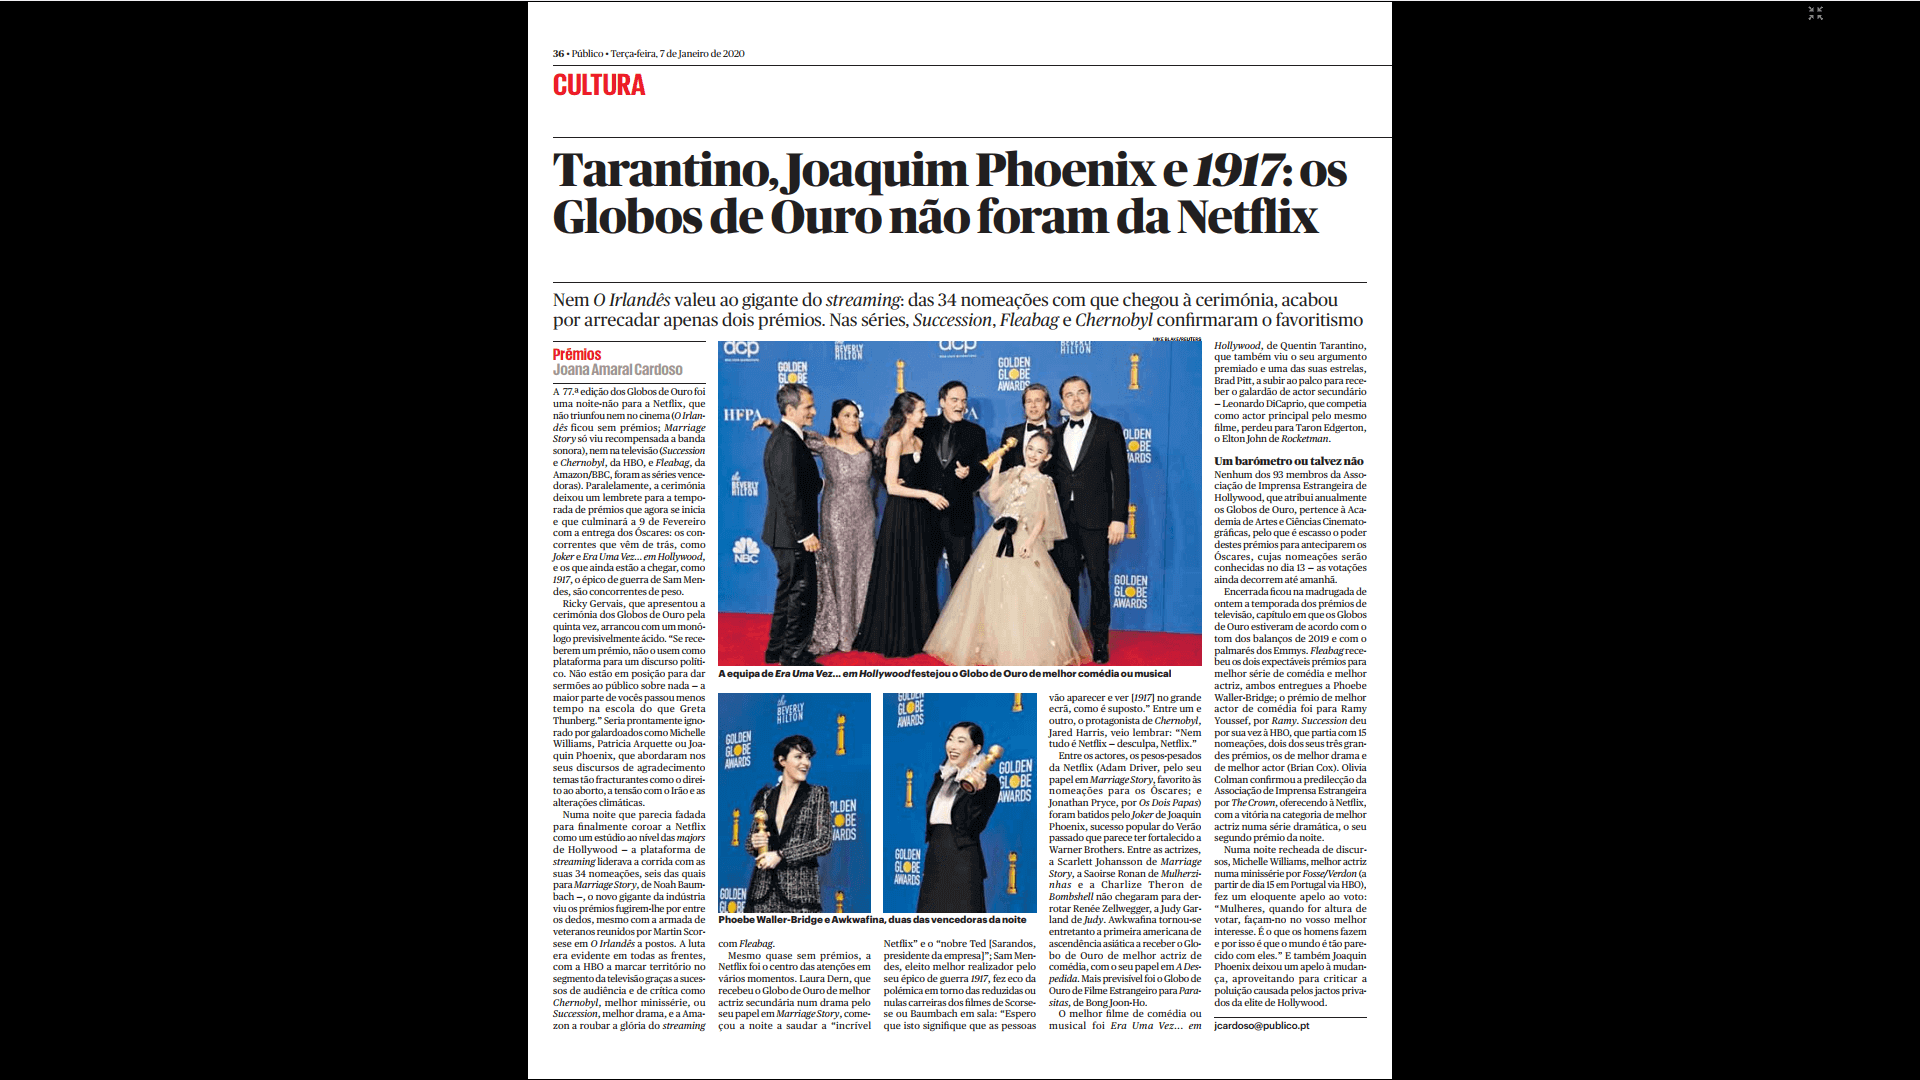 Figure 1: News Article Layout – Público
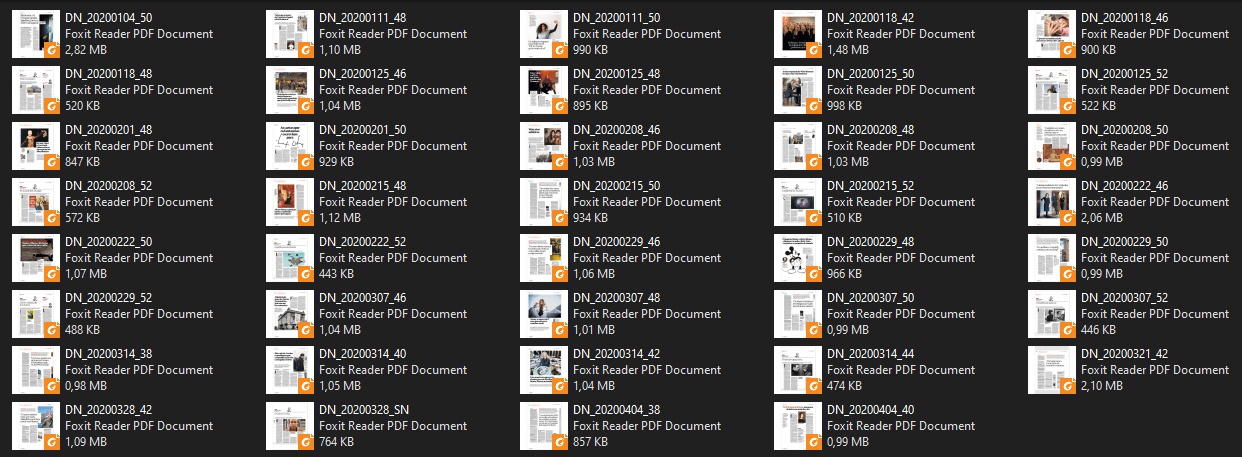
In the screenshot below, it is possible to see the batch of files prepared and catalogued for integration within the MAXQDA project file:
File sorting based on some simple rules was performed to optimize necessary handling throughout the time. The media files were analysed using the following parameters:
- Publication date and page number – to identify the documents accordingly, including the necessary temporal references;
- Number of articles in the considered section – to compare quantities/variety of the coverage, or to identify who was responsible for most of the articles;
- Article title – to assist the unique identification of each individual piece;
- Subject – music, literature, cinema, performative arts, among many other options;
- Type – news article, opinion, chronicle, revision, report, review etc.
- Geographic scope – to foresee whether the writings refer to national events or international initiatives;
- Byline – i.e. to verify who is liable for the text, who is regularly writing for the section (e.g. interns vs. experienced journalists), the sources of information considered (e.g. informal, official, syndicated content from news agencies);
- The period of time considered – i.e. the contents refer to past events, current affairs, or future activities
Certain functionalities available in MAXQDA are especially useful in this type of analysis once the data has been prepared properly. The analysis grid has been elaborated in advance and transferred to the ‘Code System’ and to the ‘Document Variables’. The extraction/import of tabulated data is possible; thus, all types of micro-level adjustments are feasible to achieve a seamless import of pre-processed data:
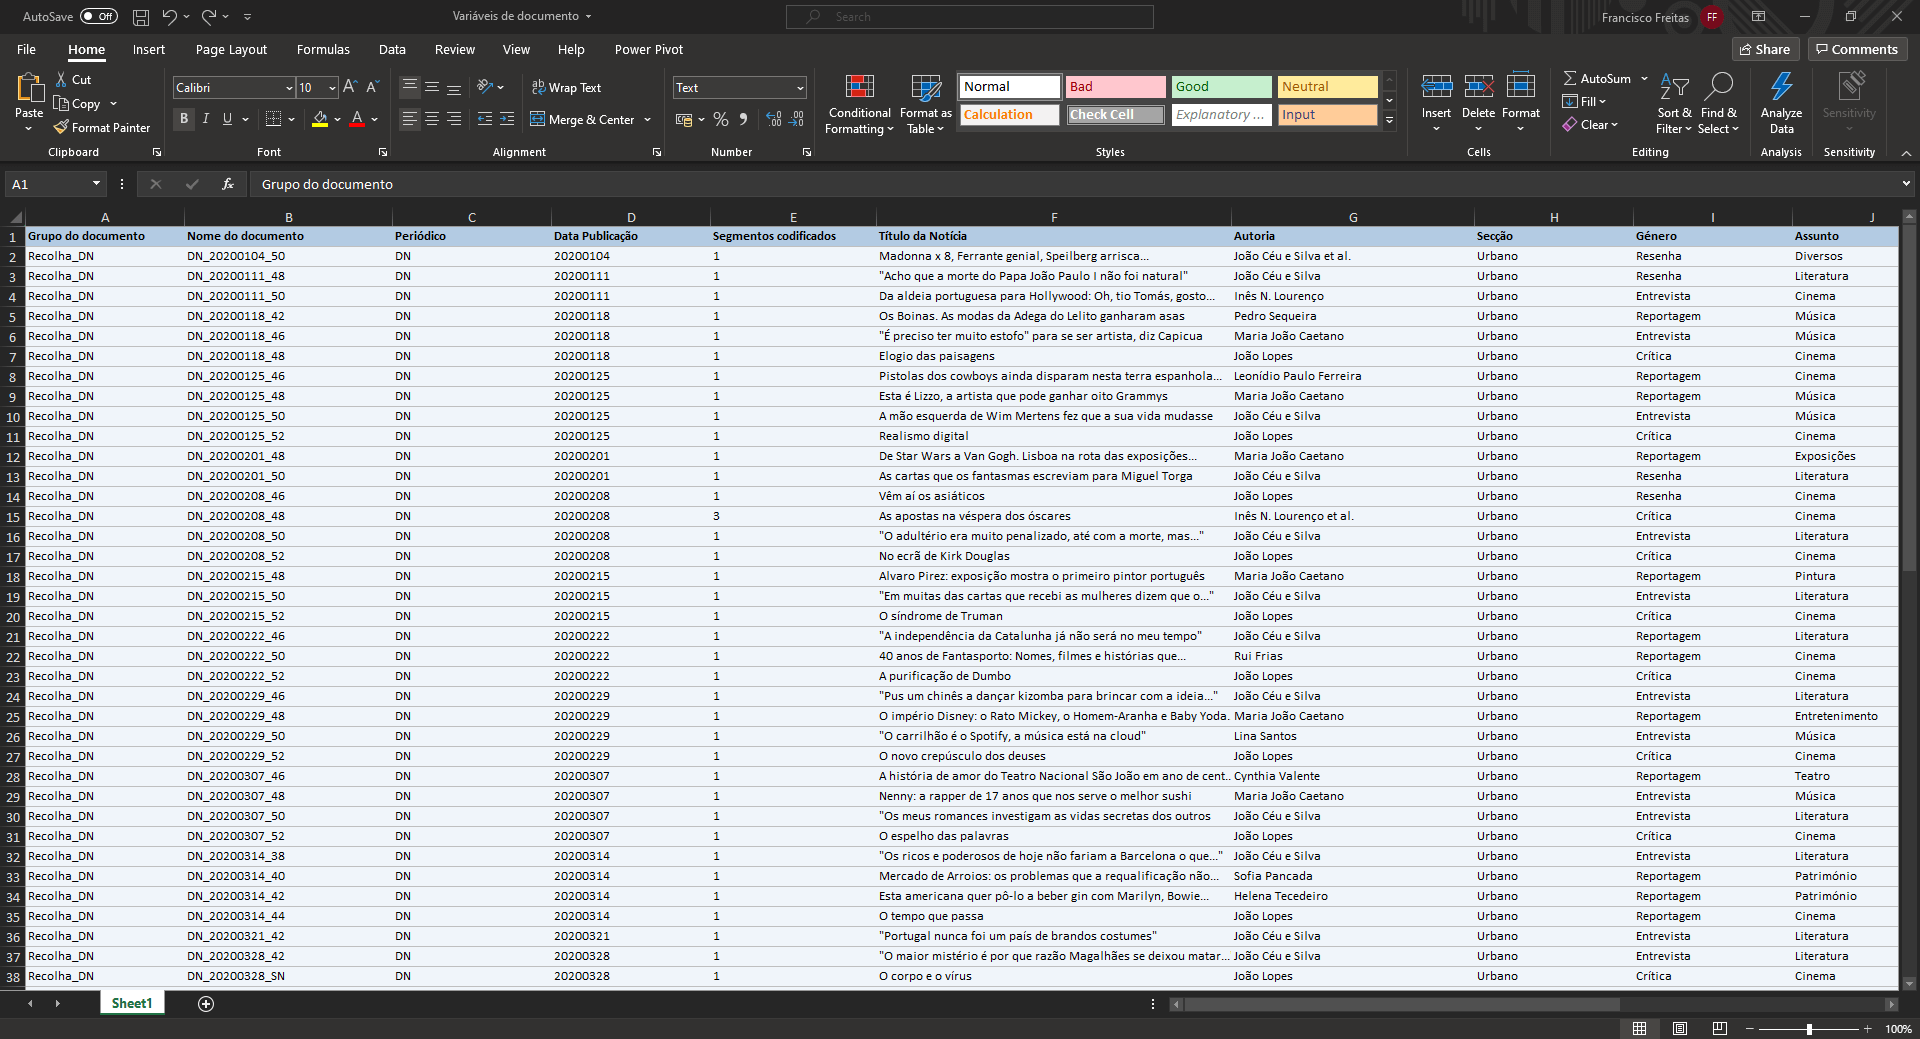 Figure 3: Tabular data extracted from MAXQDA
In the MAXQDA Project file (‘.mx20’), there is the option to directly open PDFs in a web browser, multi-tab style, something that is very effective in terms of data access. The software therefore works as a screen reader, with several options available. Among the possible tasks are coding, searches, or querying (Kuckartz, 2014; Kuckartz & Rädiker, 2019). This proximity to research data proves to be a very important characteristic:
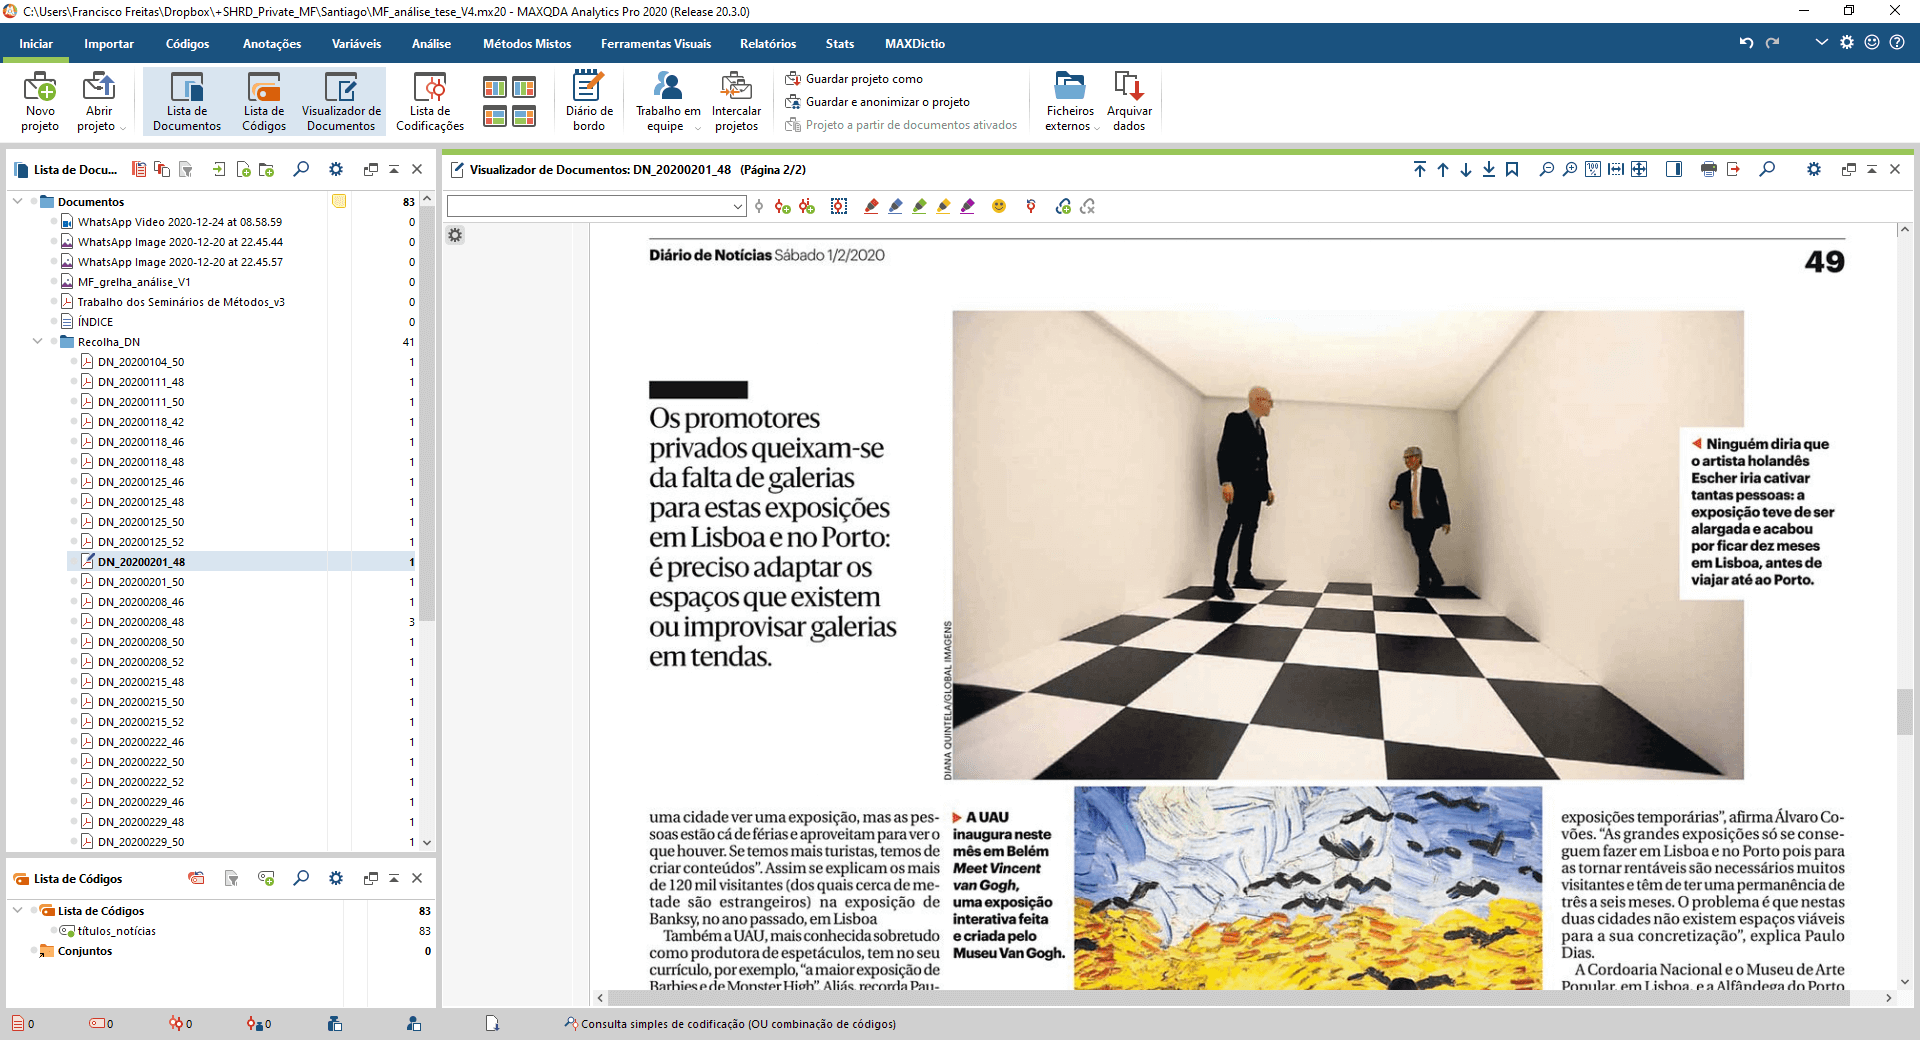 Figure 4: MAXQDA internal organization
In the ‘Document List’, all the files have been organized in different folders (i.e. document groups). This is an important step since the analysis criteria is assembled by combining different elements, including relying on document groups to accomplish important comparisons. Inside the ‘Code List’, the free coding of data is possible, based on a thorough reading and interpretation of the textual and graphical contents. Text entries can be coded accordingly, while the user can migrate the resulting information to other formats – in the case of the news titles that deserved special attention:
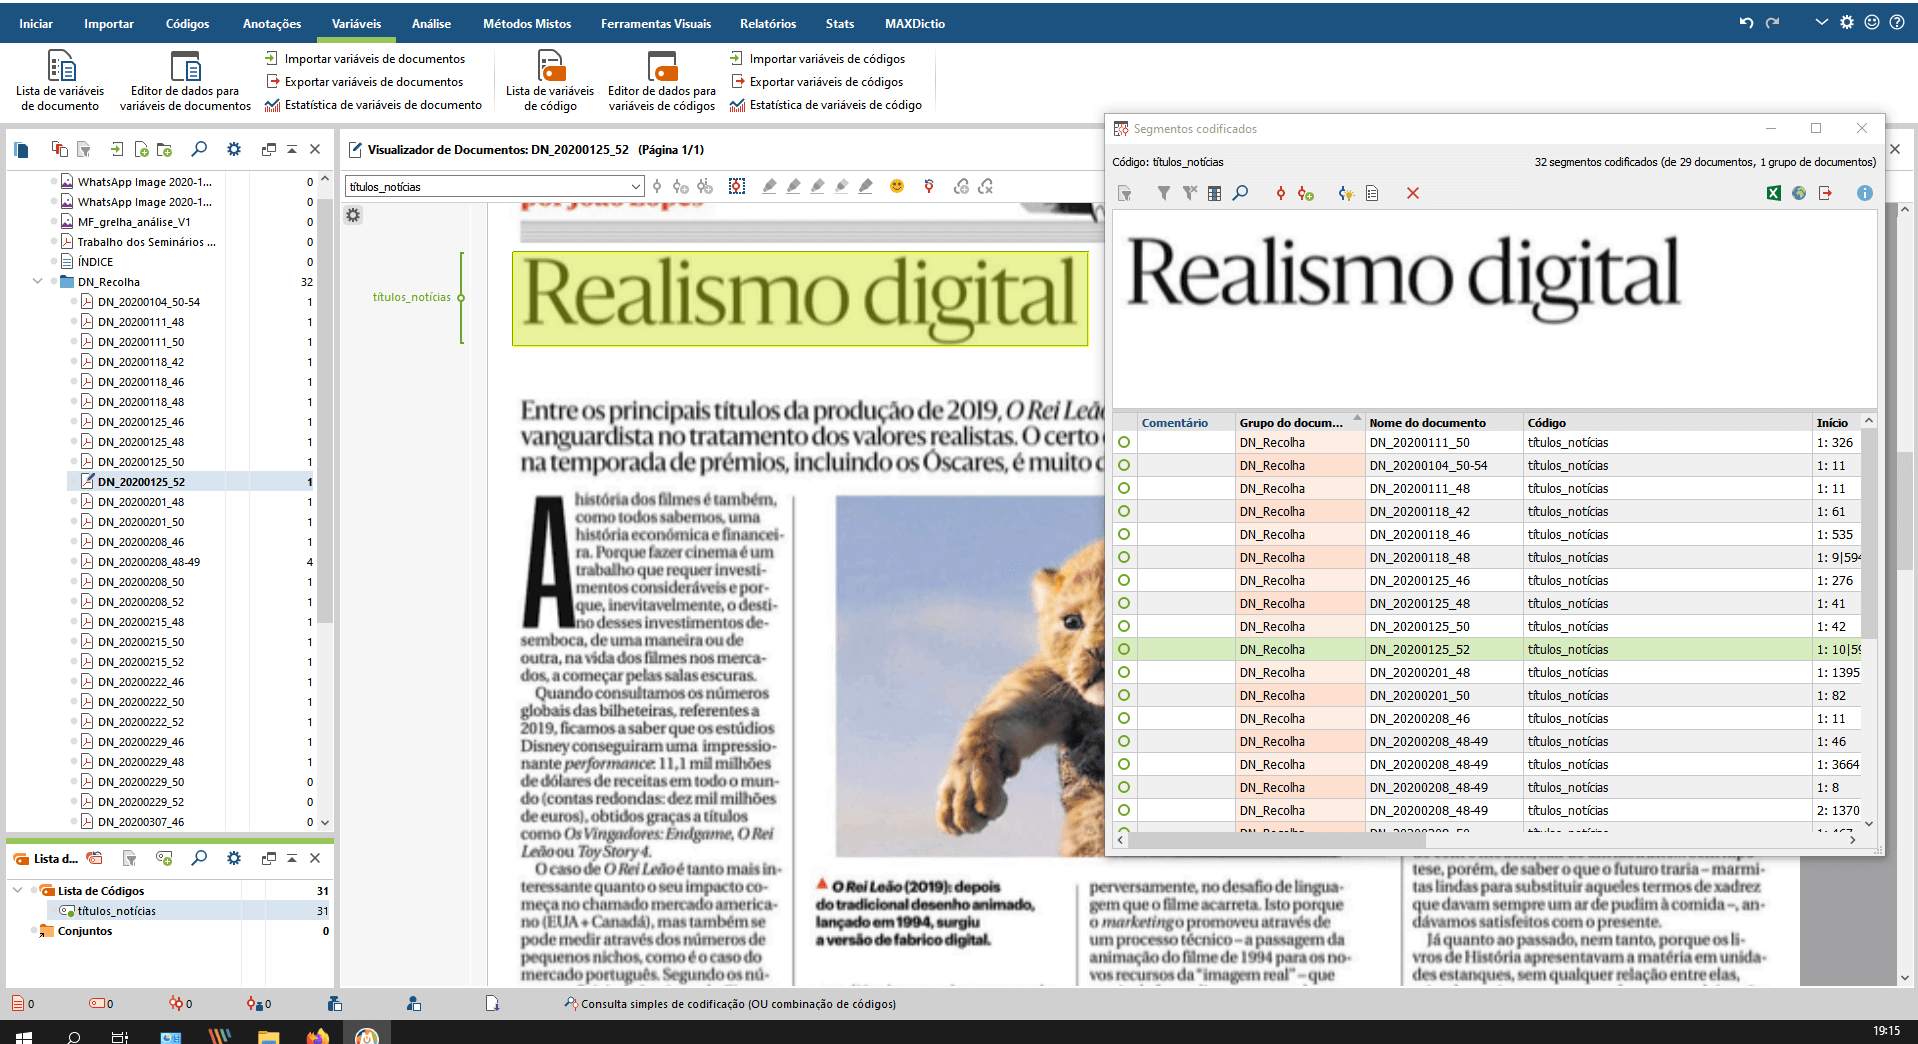 Figure 5: Managing images within MAXQDA
The titles were compiled into a table after coding. In fact, inside MAXQDA, most of the information can be summarized into tables, a baseline feature of this software programme. The more complex the dataset, the handier the option of having relevant information in tabular format:
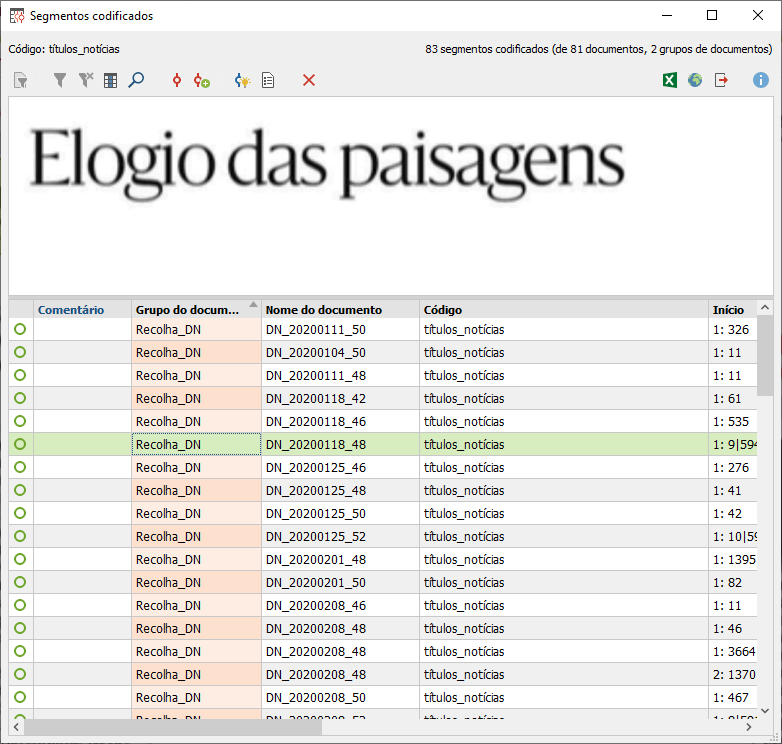 Figure 6: Example of a news article title
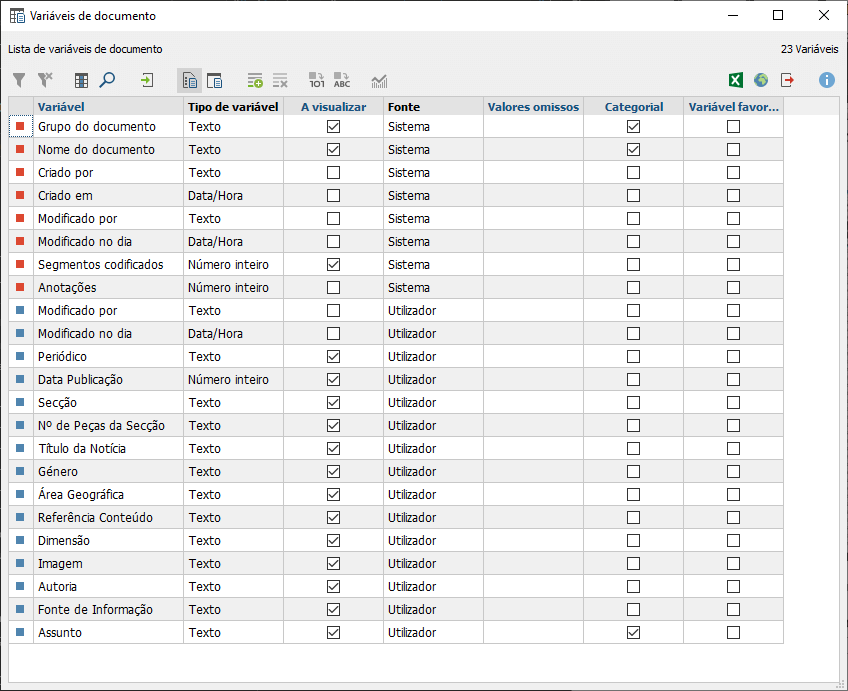
In terms of the ‘Document Variables’, they allow the construction of a classification system based on the unchanging information available. This step is important for the implementation of further analysis criteria. The variable list is presented in the following screenshot. It comprises system variables, in red, with the user variables marked in blue:
The data editor offers the necessary options to manage and to update entries anytime. It is easy to locate every entry (i.e. document) and its corresponding metadata. Integrating tables generated externally is an easy task to complete within MAXQDA as well. Nevertheless, users find several options to exchange information available in the project file. The variables simplify fine-grained analysis using extensive or complex datasets:
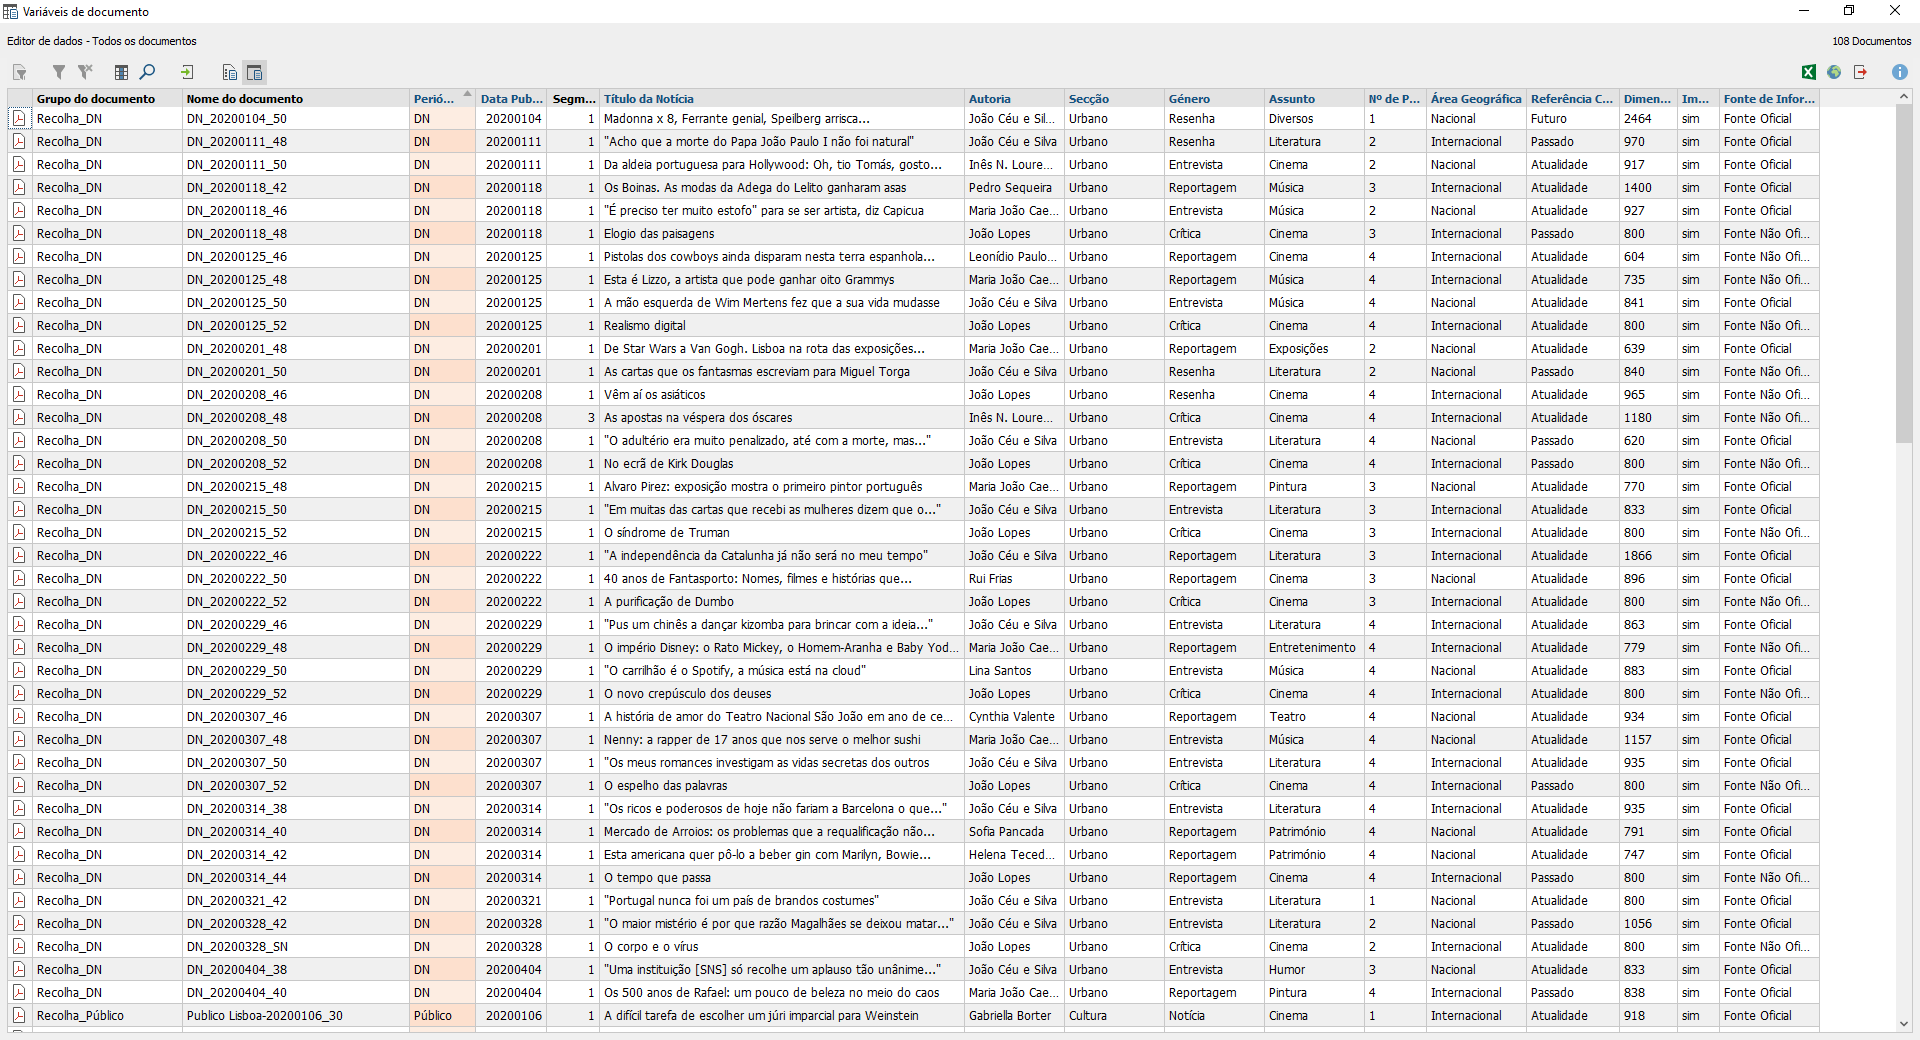 Figure 8: Data Editor for variables
Results
In MAXQDA, several operations have been completed to retrieve results. Quantitative processing has been combined with manual coding of the entire dataset. Descriptive statistics were collected, along with a few diagrams and graphs to directly illustrate the research findings. Some examples are presented subsequently:
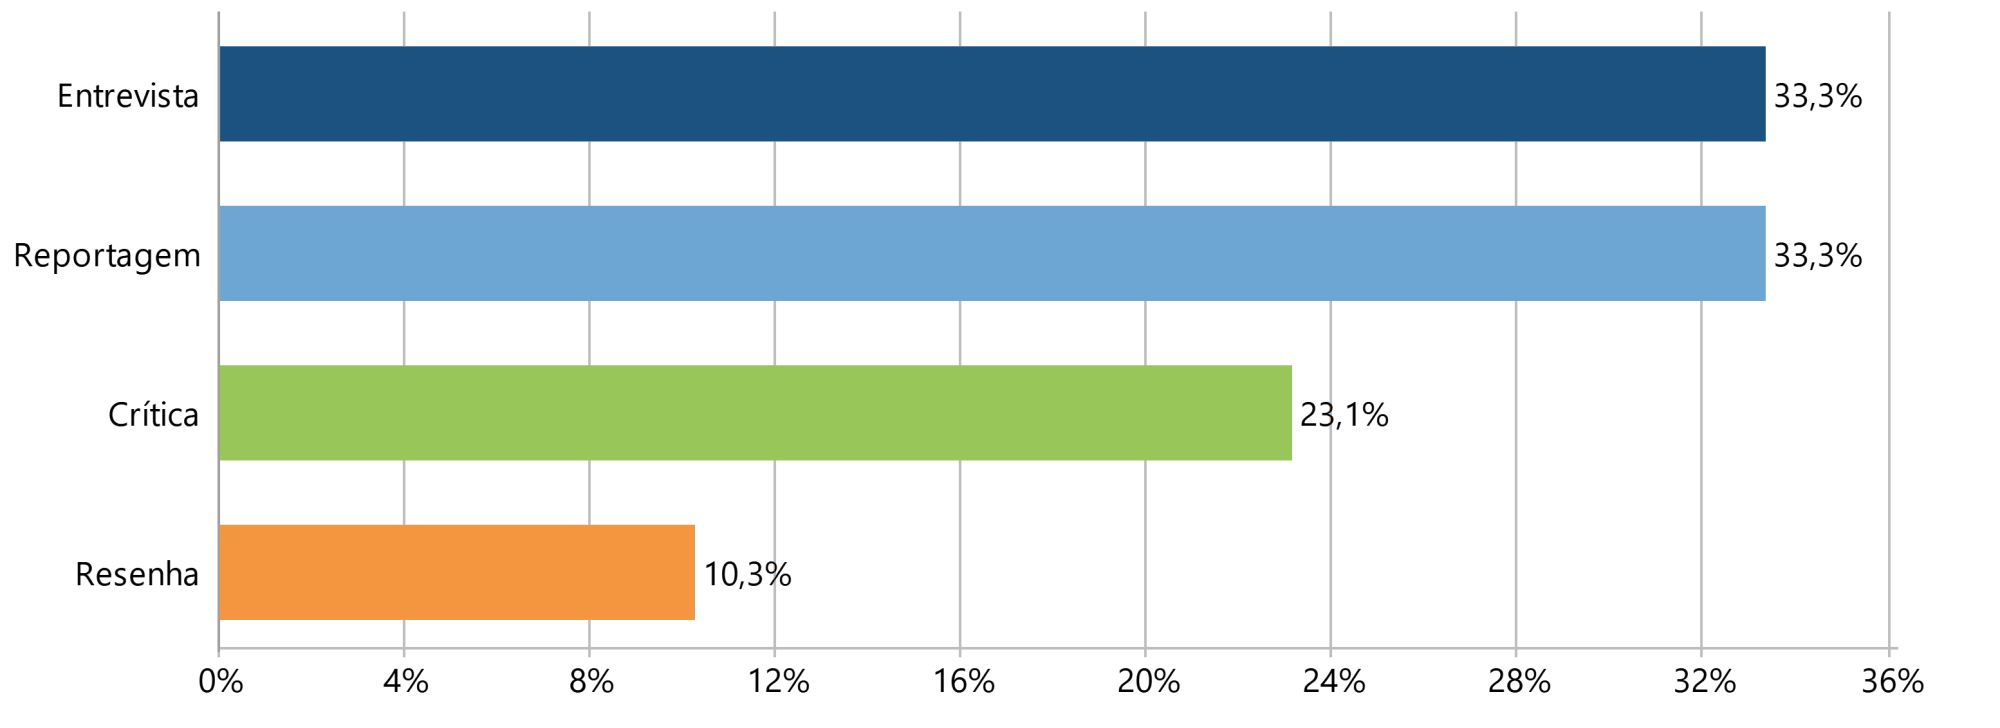 Figure 9: Example of a bar chart in MAXQDA
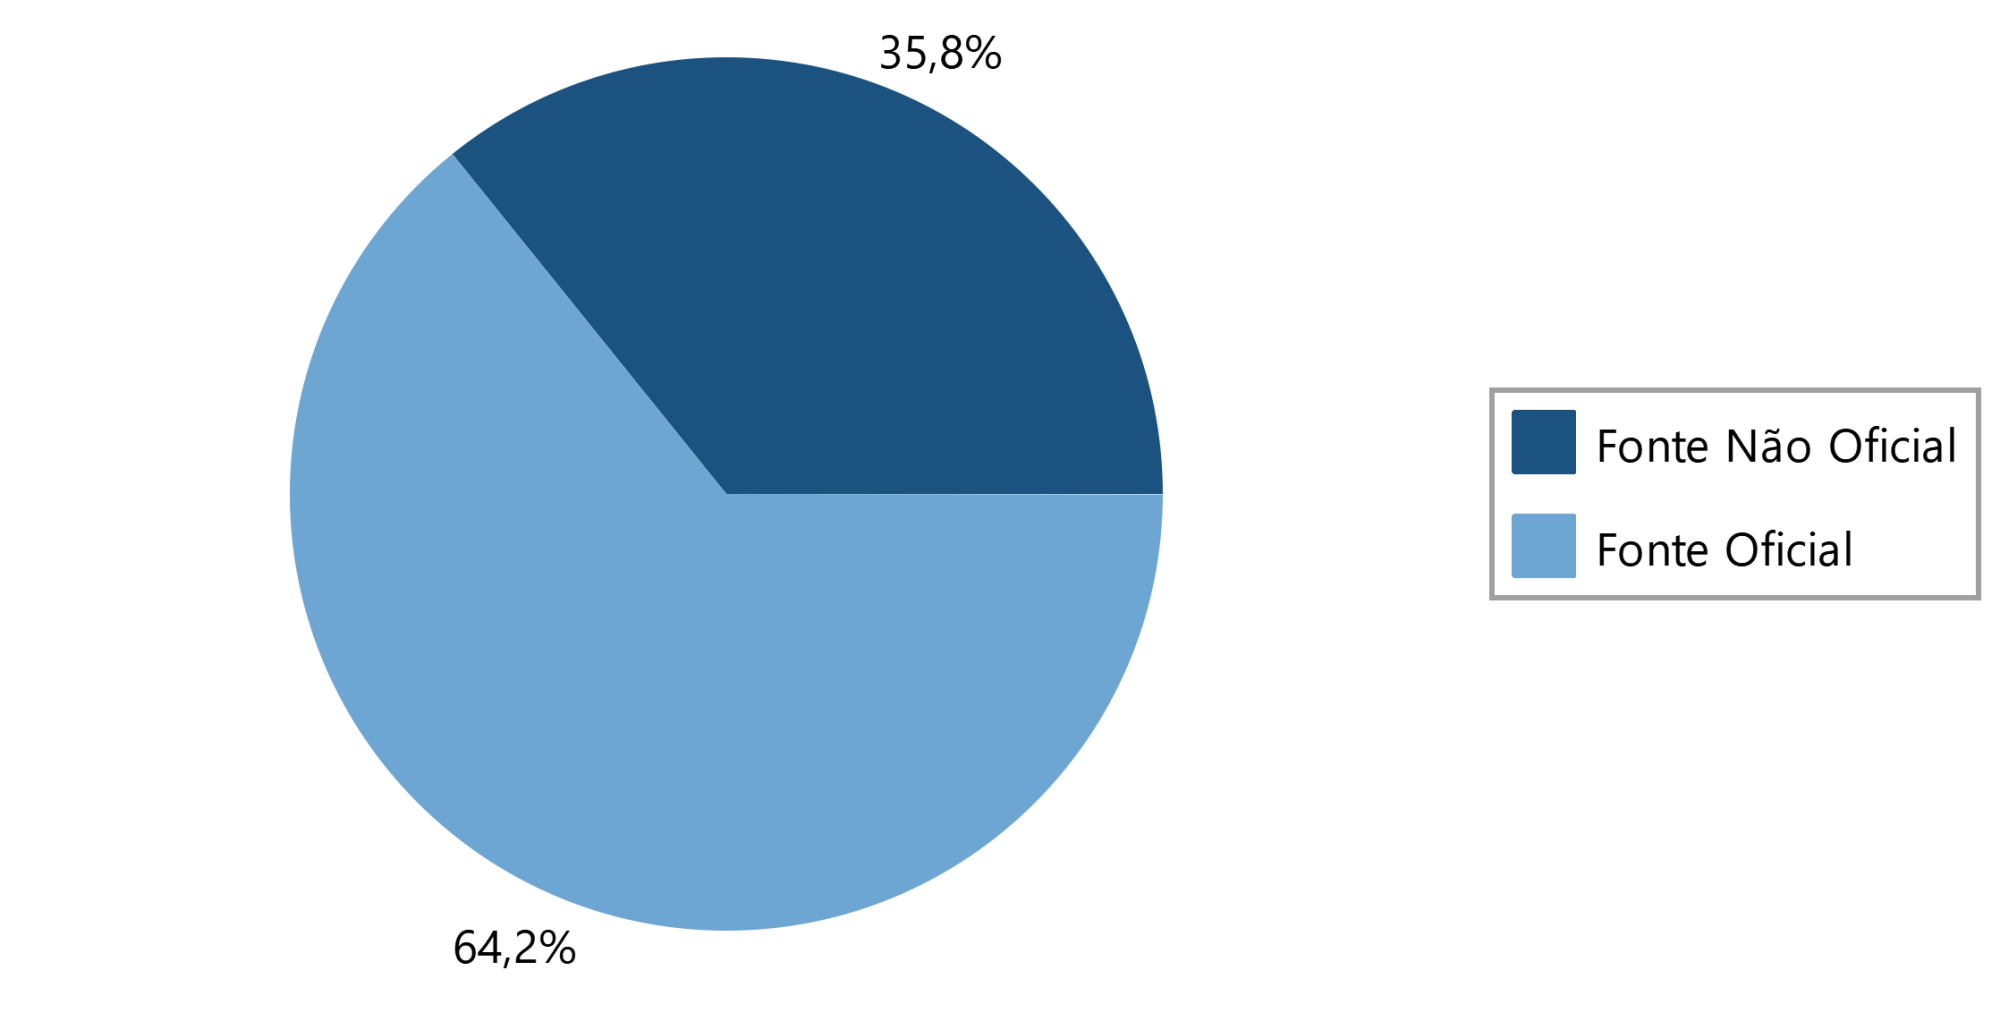 Figure 10: Example of a pie chart in MAXQDA
The integration between the ‘quanti’ and ‘qual’ within the same software package constituted a catalyst for effective analysis work. The researcher has the freedom to ask all sort of questions pertaining to the data and to combine elements in a myriad of ways, even when dealing with unstructured rich data. Research is about experience; about trial and error exercises. MAXQDA offers the chance to play thoroughly with the data. In the research process, it is not a problem to find a missing hypothesis, as long as the practitioner is able to 1) provide some sort of empirical evidence; 2) gather the necessary elements and submit them for analysis swiftly upon investing some time preparing a dataset. In practical terms, we can perform advanced queries of data, together with search functions including logical operators or operations with subsets after completing the necessary readjustments in an interactive approach. This provides full support to tackle research questions.
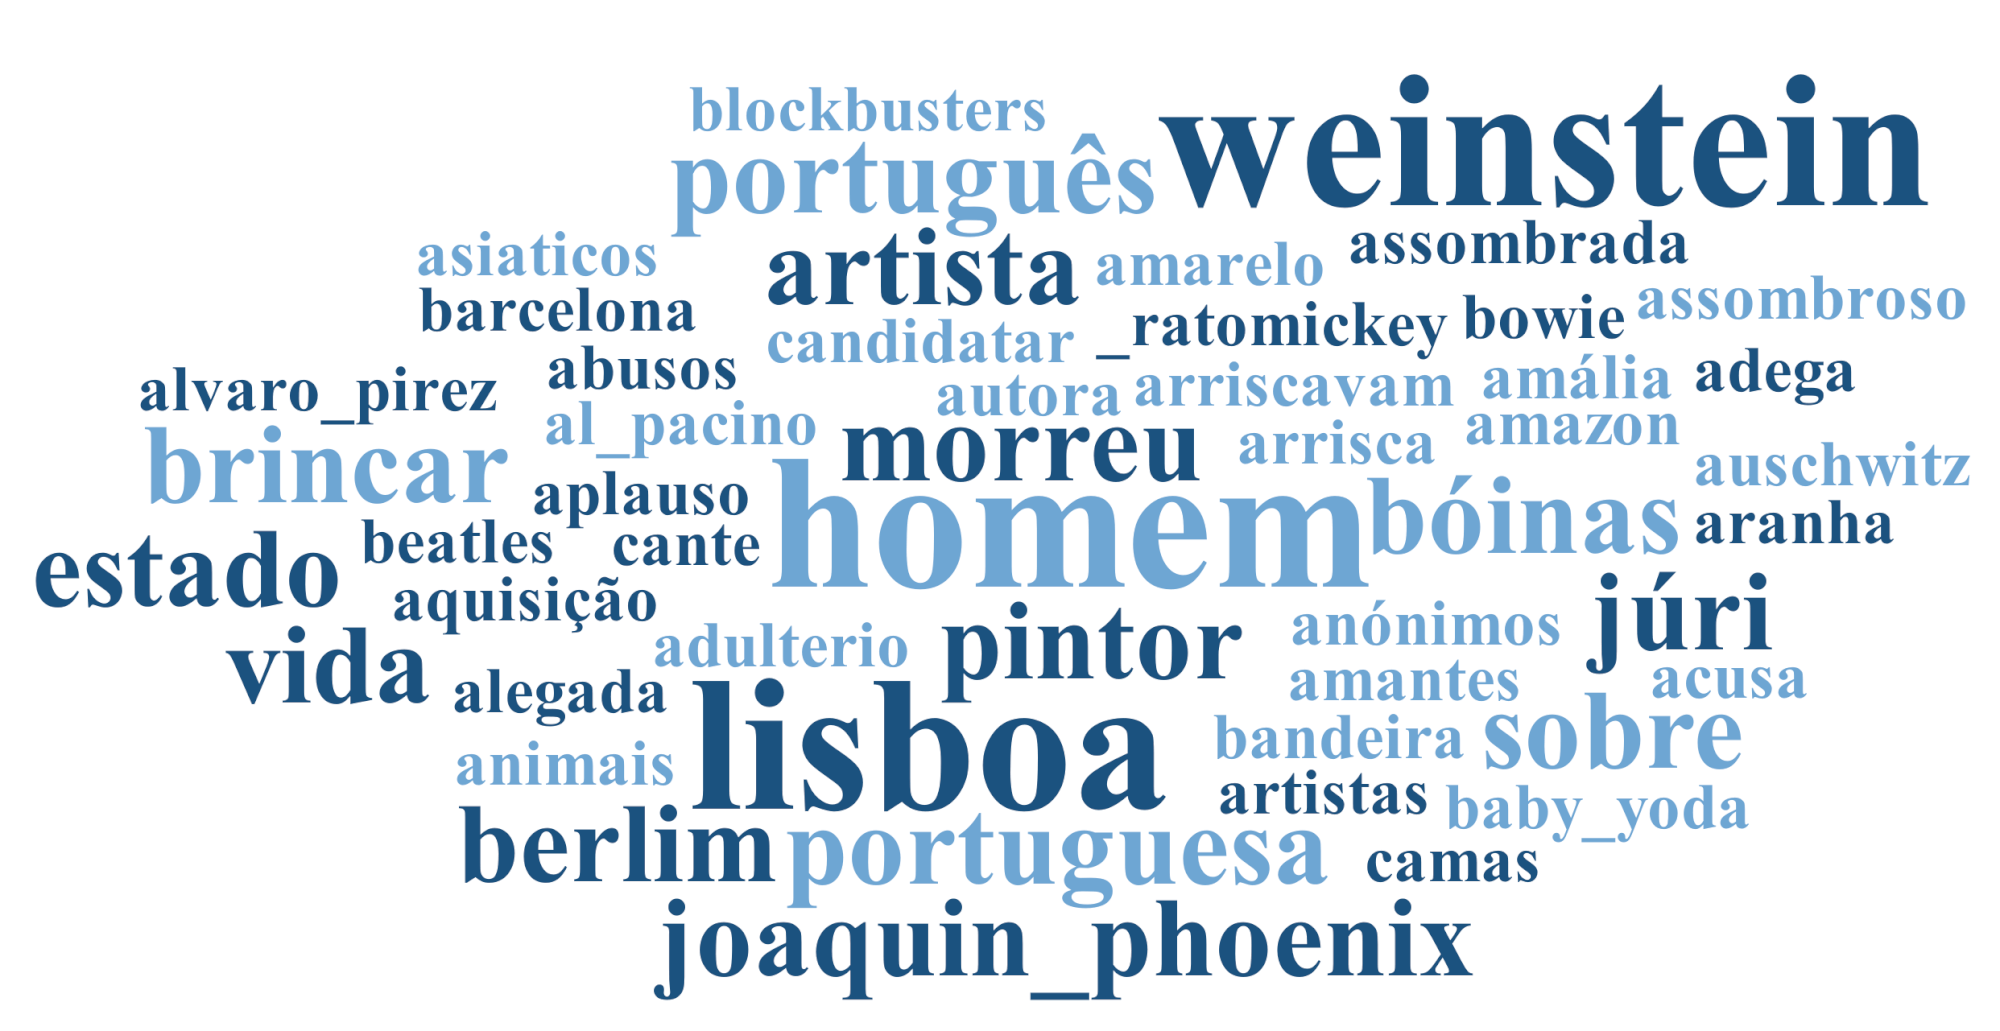 Figure 11: Example of a Tag Cloud in MAXQDA
After describing, in brief, the performed research, it is important to highlight one of the main conclusions retrieved during the process. The more traditional media outlets provide an important service for disclosing events offered by the cultural sector in Portugal, as well as disseminating international creations to a broad audience. This is particularly relevant for performers or groups who lack the resources to: 1) compete for attention from the general public; 2) reach or broaden their target audiences.
About the author:
Maria Freitas completed is doctoral research in the Faculty of Comunication Sciences, University of Santiago de Compostela, in Galicia, Spain. The thesis is entitled ‘A Utilização de fontes jornalísticas na produção de jornalismo cultural’. Maria works as a communication management professional for several years across companies from different sectors. Technical supervision and guidance was provided by Maria’s brother; our colleague and MAXQDA advanced user Francisco Freitas.

 Maria Freitas completed is doctoral research in the Faculty of Comunication Sciences, University of Santiago de Compostela, in Galicia, Spain. The thesis is entitled ‘A Utilização de fontes jornalísticas na produção de jornalismo cultural’. Maria works as a communication management professional for several years across companies from different sectors. Technical supervision and guidance was provided by Maria’s brother; our colleague and MAXQDA advanced user Francisco Freitas.