We are proud to present the MAXQDA 2022.1 update with a series of improvements, fixes and new features! We are continuously developing MAXQDA to make your research with MAXQDA even more enjoyable. Below are a few highlights of the latest update, but you are welcome to have a look at the complete list of improvements here or get a first impression of the main innovations in this short video.
How to update MAXQDA 2022
To install the update, follow these three easy steps:
- Open MAXQDA 2022 with a stable internet connection.
- Select the “?” query symbol in the top right-hand corner of the screen
- And select “Search for Updates” from the menu.
MAXQDA will then install the new update and you can access the following new features and many more improvements for free! If you are using one of your institution’s computers and have limited admin rights, please contact your local administrator.
Import VTT transcripts
Microsoft Teams, Zoom, and other transcription tools
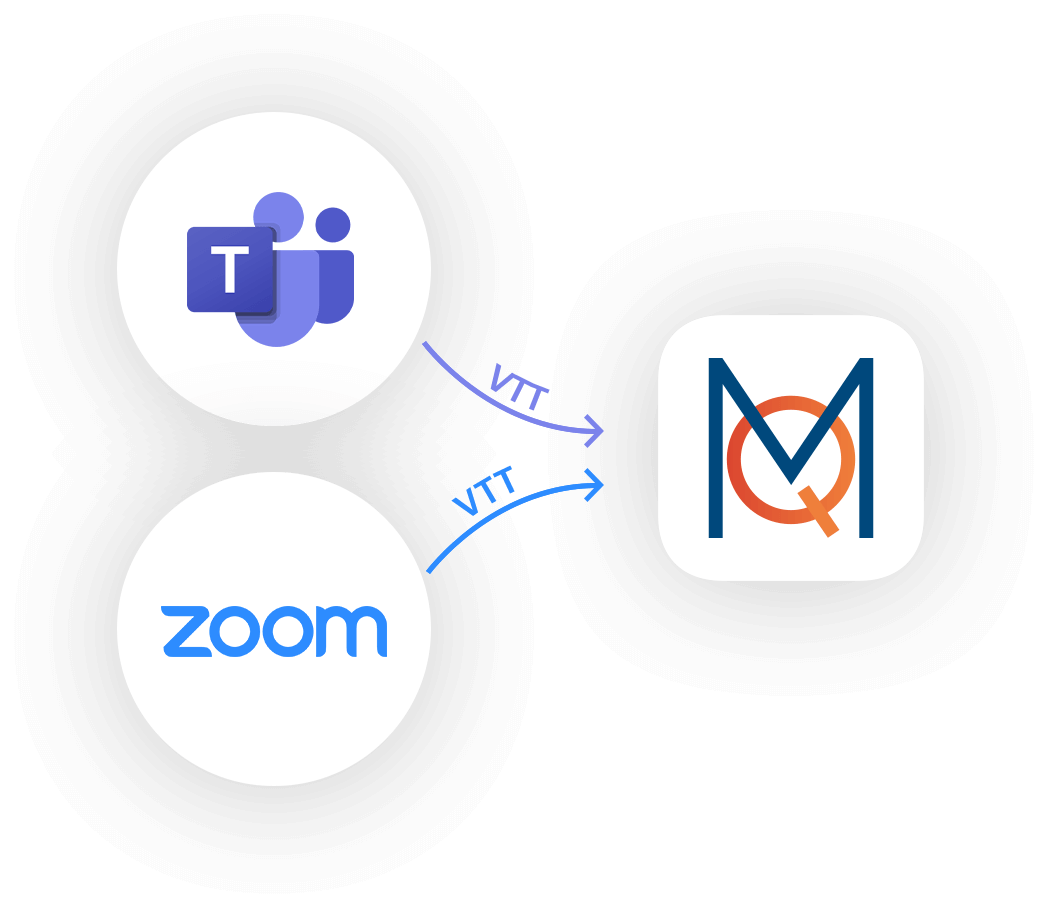
You can now import transcripts from your Microsoft Teams or Zoom meetings (VTT files). MAXQDA will transform the file into a clean transcript, identify speakers, speaking pauses, and insert time stamps so you can link the transcript to the audio and video file.
Import multiple web pages at once
Include additional info as variables
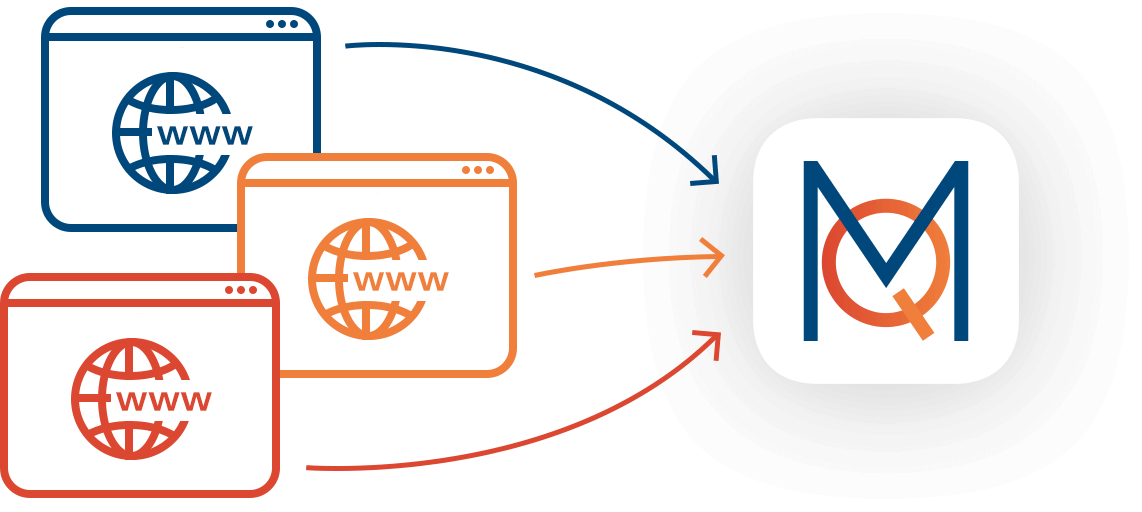
Bulk import multiple webpages into MAXQDA at once. Instead of collecting websites one by one, you can now import full webpages from an Excel list of URLs alongside important information about each page. You can also select which information should be saved as document variables or added to the document memo. Web pages can be imported as PDF documents with their complete layout, simplified web pages, or PNG images.
Questions, Themes, Theories (QTT)
Your space for thoughts and analytical results
MAXQDA 2022 introduced a brand new and innovative workspace called QTT to gather important visualization, notes, segments, and other analytics results! QTT supports you during the analysis phase after coding and is the perfect tool to collect relevant insights and develop new theories.
Collect diagrams and tables
You can now collect even more analytics findings in QTT worksheets. You can now collect diagrams and tables from features like subcode statistics or crosstabs. Send them directly to a QTT worksheets with one click and add relevant notes and insight for each table or diagram.
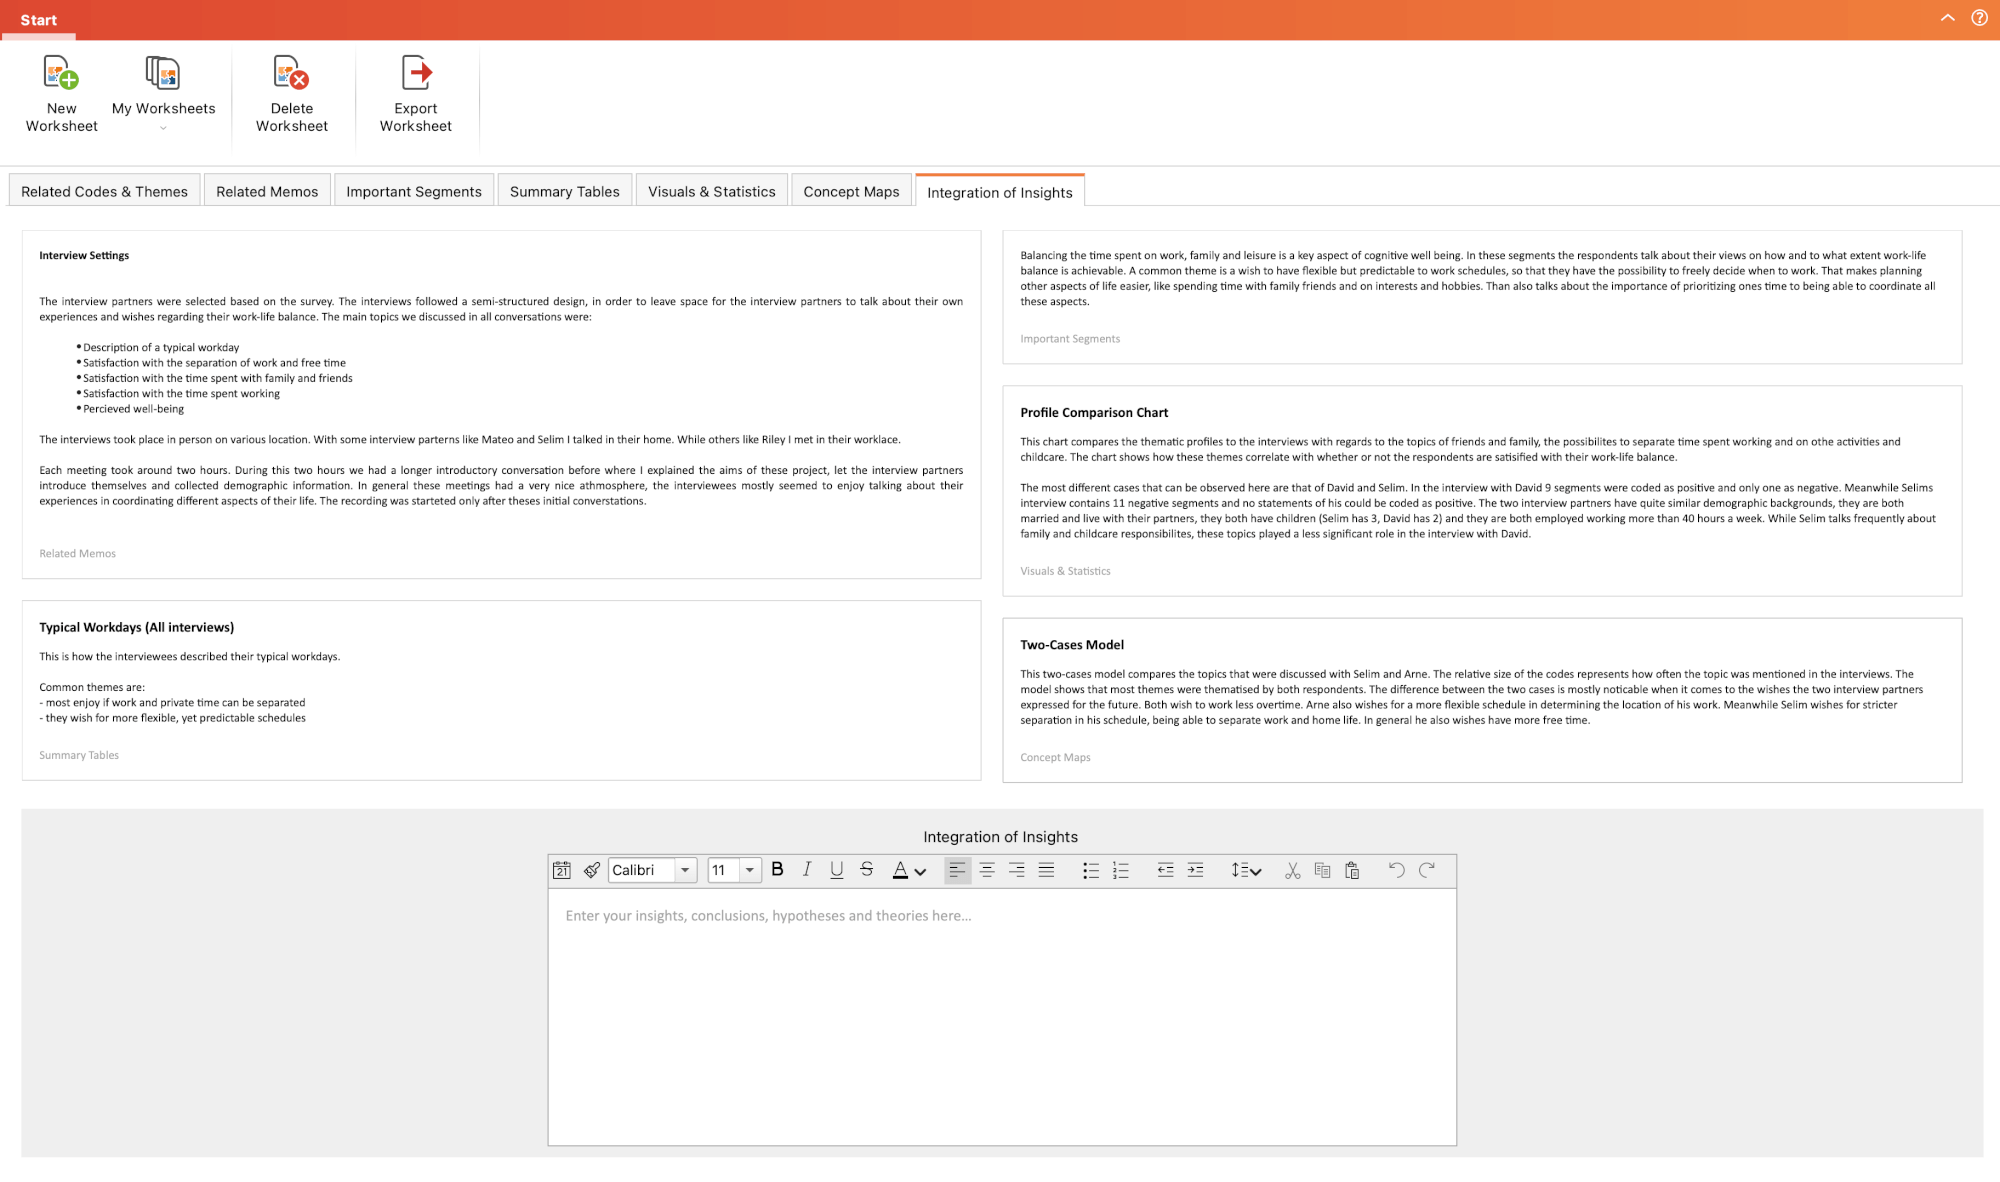
Insights Tab
All your insights in one place. The “Integration of Insights” tab in QTT has been extended to show all the insights written for any element within this worksheet. Scroll through your notes and insights, or focus on insights from one specific tab. This makes it easy to bring it all together to integrate them into overall conclusions, and to develop hypotheses and theories.
Survey Analysis
Sentiment Analysis and Code with Sentiment Score
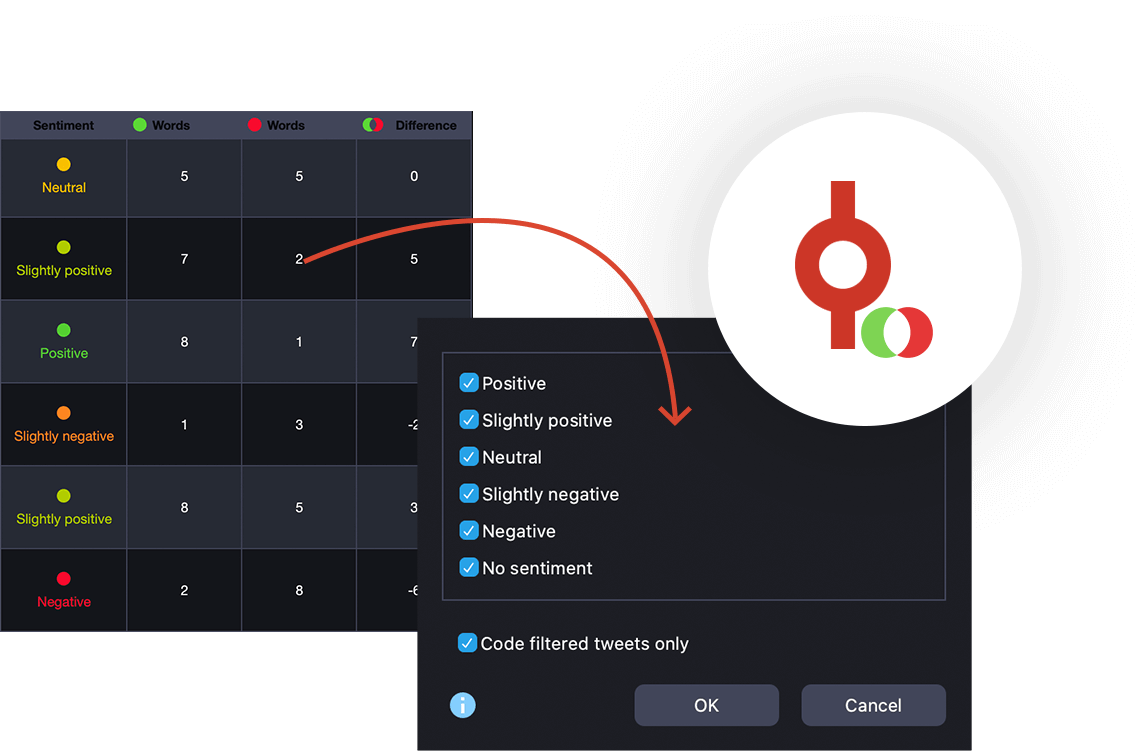
We are thrilled to announce the release of MAXQDA’s Sentiment Analysis for Survey Data! Sentiment Analysis is a valuable tool for quickly perceiving emotions, feelings, and opinions of individuals towards a certain issue, product, service, or event in different application fields. You can now quickly identify the tone of the responses in your dataset and/or code the responses with their sentiment scores.
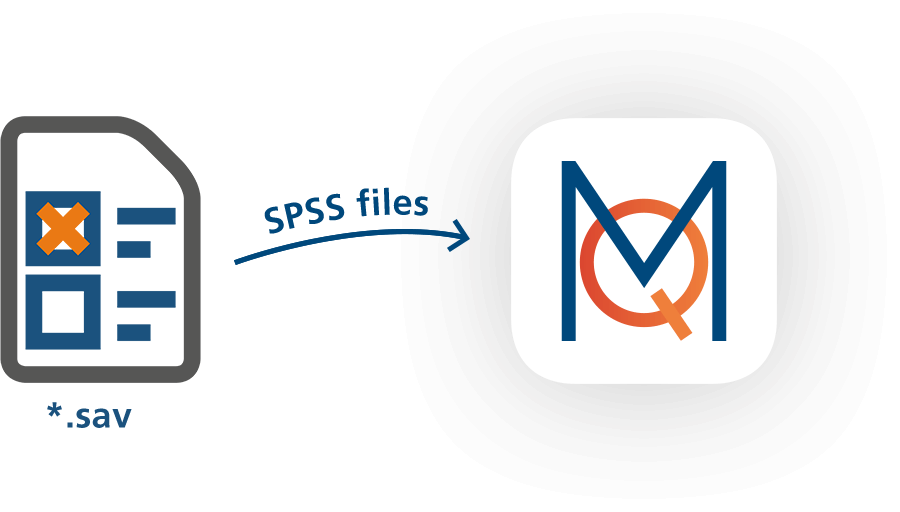
Import Survey Data from SPSS Files
Mixed methods analysis made easy. While importing survey data from SPSS files (*.sav) MAXQDA can now recognize additional information: variable labels, value labels, statistical scale.
Word Count
Easily access information about the length of survey responses and sort responses by length. The new word count feature is available in the “Categorize Survey Data” workspace.
Word Cloud for Responses
Get a quick overview of the most frequently used words in answers to open-ended questions with the new Word Cloud for survey answers. This new feature is available in the “Categorize Survey Data” workspace.
Focus Group Analysis
Compare Cases and Groups
The compare cases features are now also available for focus group speakers. Quickly compare qualitative data (coded segments) or quantitative data (code frequencies) for individual focus group participants.
Overview of Paraphrases and Paraphrase Matrix
If you have paraphrased the content of a focus group interview you can now compare paraphrases written for each of the focus group participants in the Paraphrase Matrix.
Word Cloud for Speakers
Get a quick overview of the most frequently used words for each speaker in a focus group interview.