We are constantly working on new features to improve the MAXQDA user experience. The new MAXQDA 2020.4 update includes completely new features as well as some smaller improvements to enhance your work and make data handling even more straightforward. In this article you can find some of the highlights of the current update. Of course, the update includes many other improvements – you are welcome to check the complete list of changes here.
How to update MAXQDA 2020
To install the latest update, open MAXQDA 2020 with a stable internet connection, select the “?” query symbol in the top right-hand corner of the main window and select the option “Search for updates”. Now you can explore the new features and improvements.
New features
1. Sentiment Analysis for Twitter data
We are excited to announce the release of MAXQDA’s Sentiment Analysis for Twitter imports! Sentiment Analysis is a valuable tool for quickly perceiving emotions, feelings, and opinions of individuals towards a certain issue, product, service, or event in different application fields. The core idea is to classify a large amount of unstructured data based on sentiment polarity and categorize it as positive, negative or neutral. With the growing availability of social media data in recent years, sentiment analysis has become increasingly popular among qualitative and quantitative researchers as it allows quickly identifying the overall tone of the dataset and extracting important themes for further, deeper analysis.
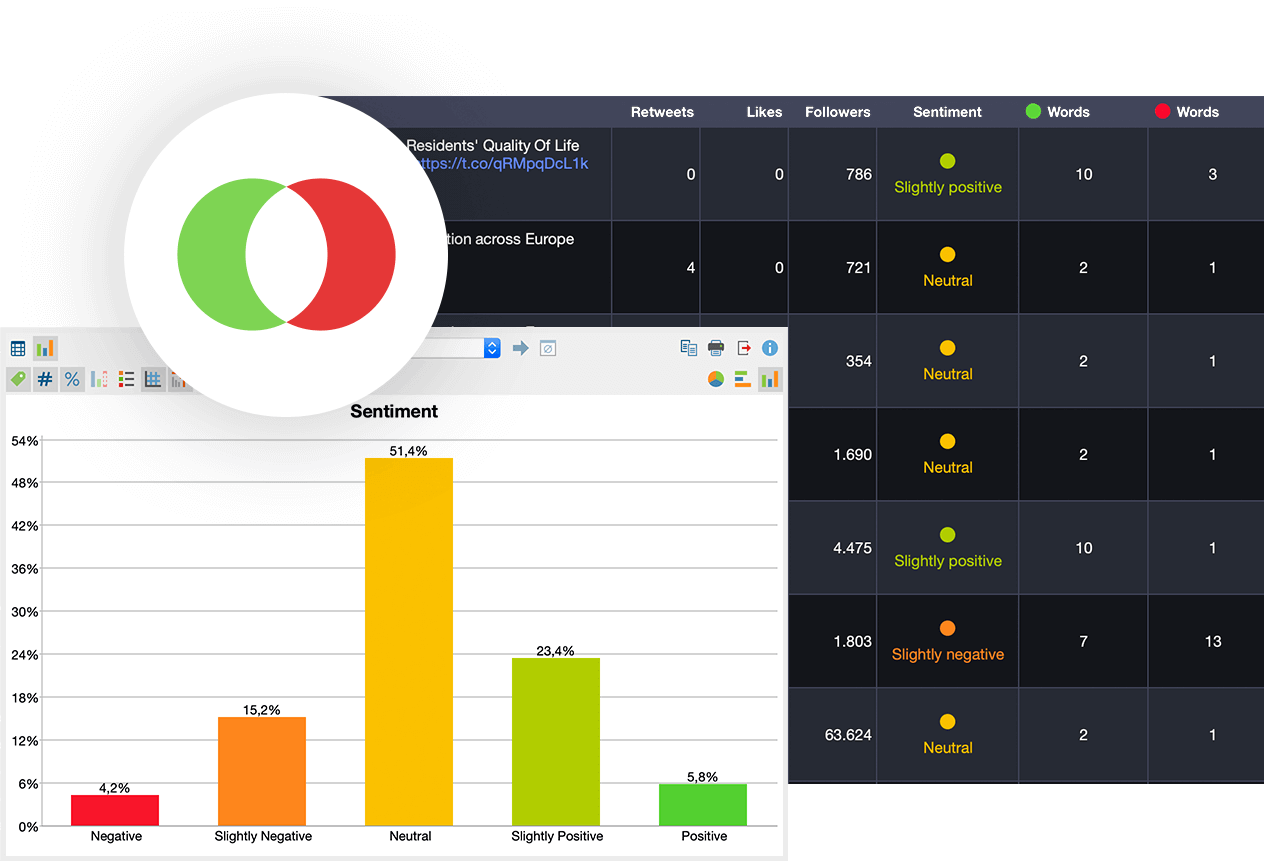 The new Sentiment Analysis feature for tweets.
MAXQDA’s Sentiment Analysis tool is designed to rapidly process unstructured Twitter data and transform it into structured subsets that are ready for further exploration in moments. By autocoding Twitter data with sentiment labels, you can capture public sentiment toward a particular research topic – in near real-time – and track longitudinal shifts in emotion over a period of time. To take a simple example: You want to monitor how public attitudes towards the development of the Covid-19 vaccine change over a period of several months. To do this, you import relevant Twitter data at specific time intervals, run sentiment analysis on each Twitter dataset, automatically code tweets with sentiment labels if necessary, and examine how sentiments in the datasets change over those months. In addition, Sentiment Statistics allow you to easily visualize the distribution of sentiments across your Twitter dataset in frequency tables and charts.
To sum up, MAXQDA’s sentiment analysis now offers the following features:
- Sentiment labelling of previously imported tweets
- Autocoding Twitter data with sentiment
- Sorting tweets by sentiment
- New sentiment filter options
- Displaying sentiment statistics
… and much more.
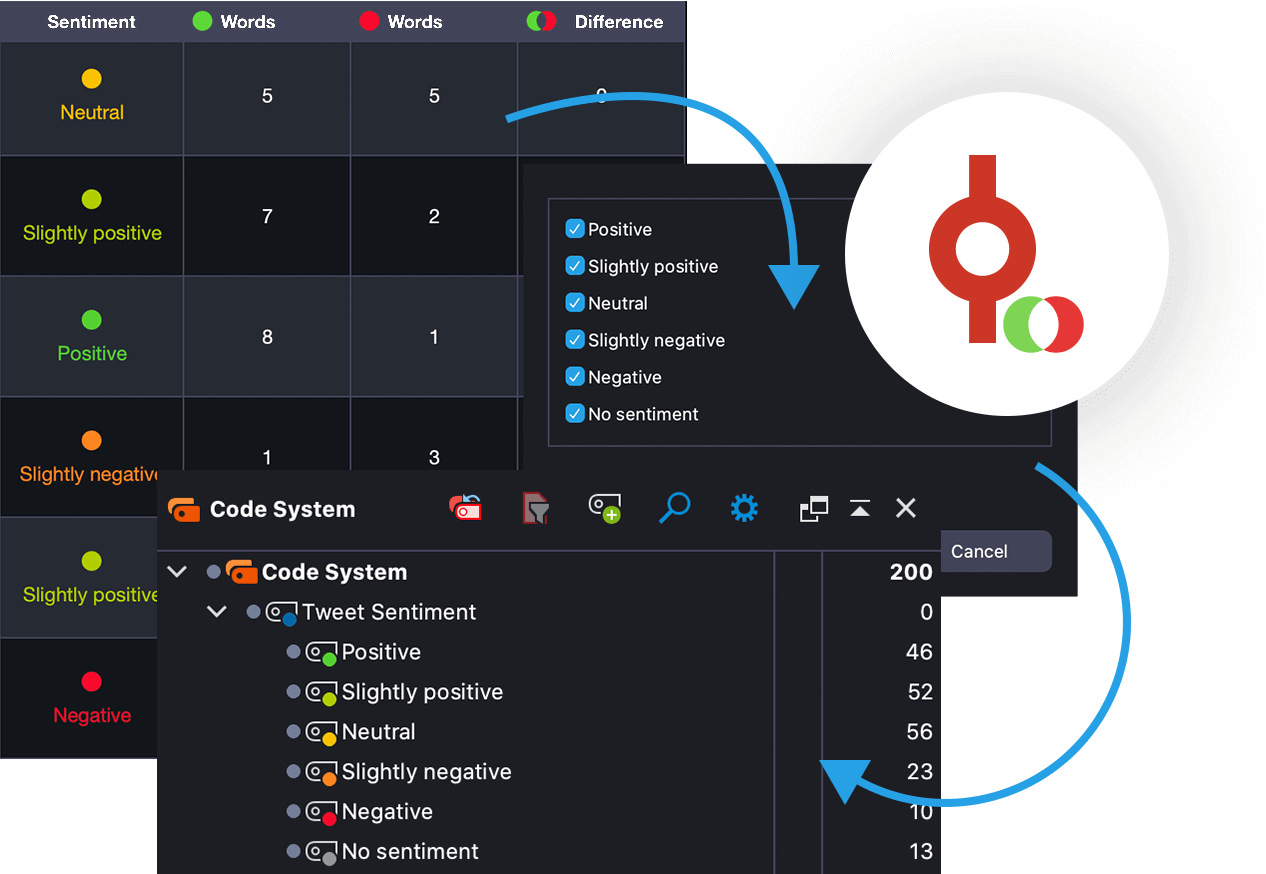 Autocoding of Sentiment Analysis labels.
Sentiment Analysis in the MAXQDA Manual
2. Improved Scatterplot customization
In this update we have introduced new diagram options and axis settings for scatterplots. They allow you to customize and adapt scatterplots to perfectly fit your needs. You can now choose to display or hide various axis elements, adjust the color of your scatterplot by picking a new color from MAXQDA’s color palette, or modify the scaling of the axes.
The update includes the following improvements:
- Labels can be turned on/off
- Scales, titles, and text can be displayed
- Axes can be scaled proportionally
- Color scheme modifications
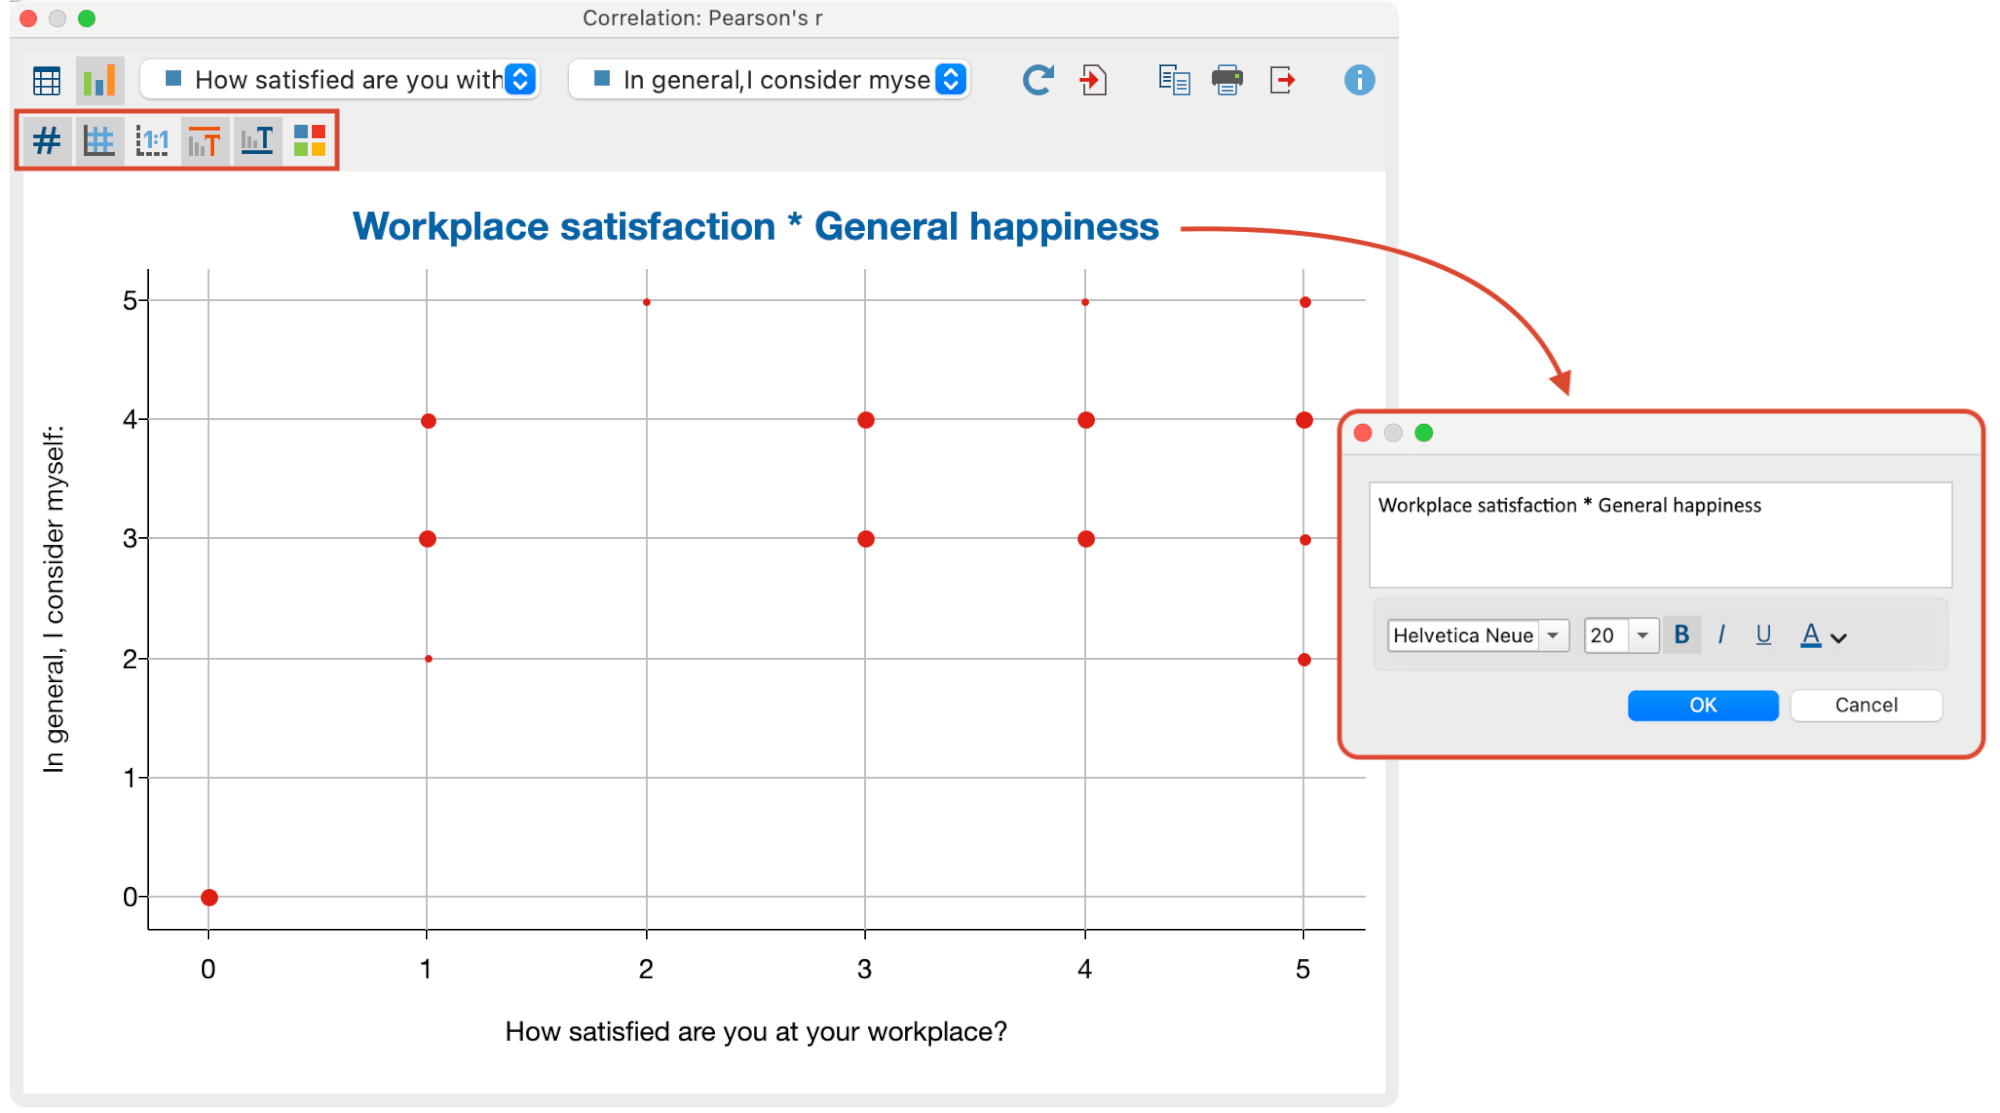 New scatterplot options for text formatting and color scheme modifications.
3. Twitter Search
When it comes to Twitter analysis, we have not stopped at developing Sentiment Analysis; we have added a new Search Tweets option to make it easier for you to look up particular tweets. Twitter search allows you to explore certain letter combinations or words within the Twitter analysis window. Identifying tweets which include specific information has never been simpler.
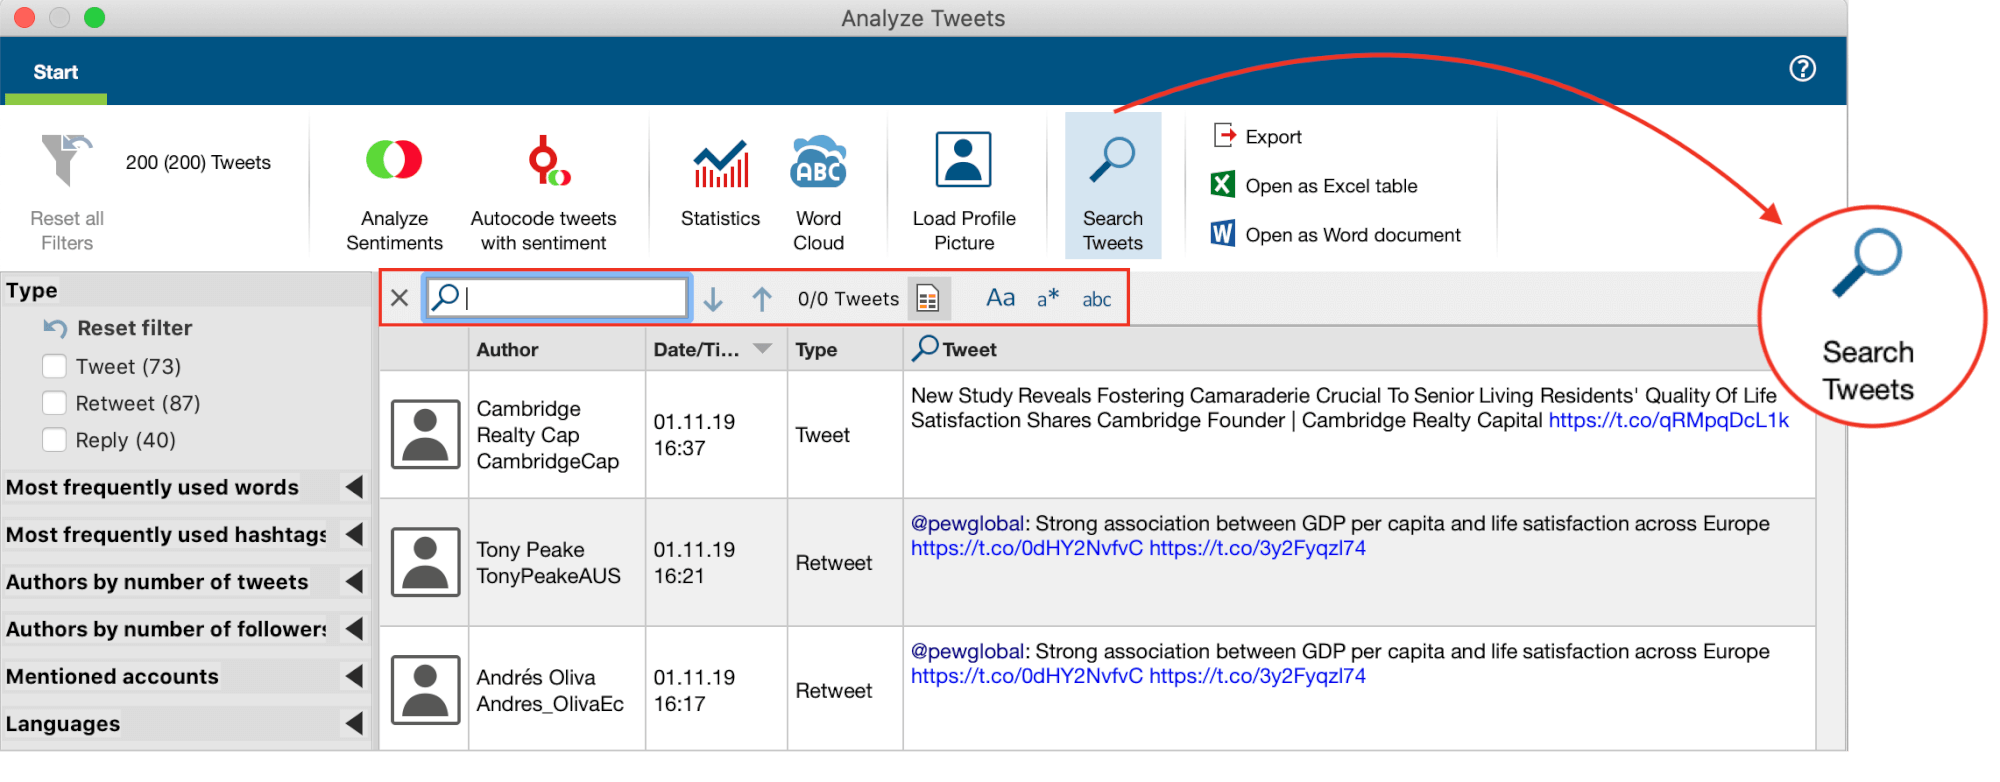 “Search Tweets” option for Twitter analysis in the MAXQDA 2020.4 update.
4. Save Cluster of Document Map as Document Set
Document maps allow you to explore similarities between multiple documents. This tool is very useful to identify clusters of documents by coding similarity and to visualize the correlation of codes across documents.
With the new update you can save any one of the document clusters in a map as a new Document Set – or just click on the option in the ribbon menu to save all of your clusters as Document Sets at once.
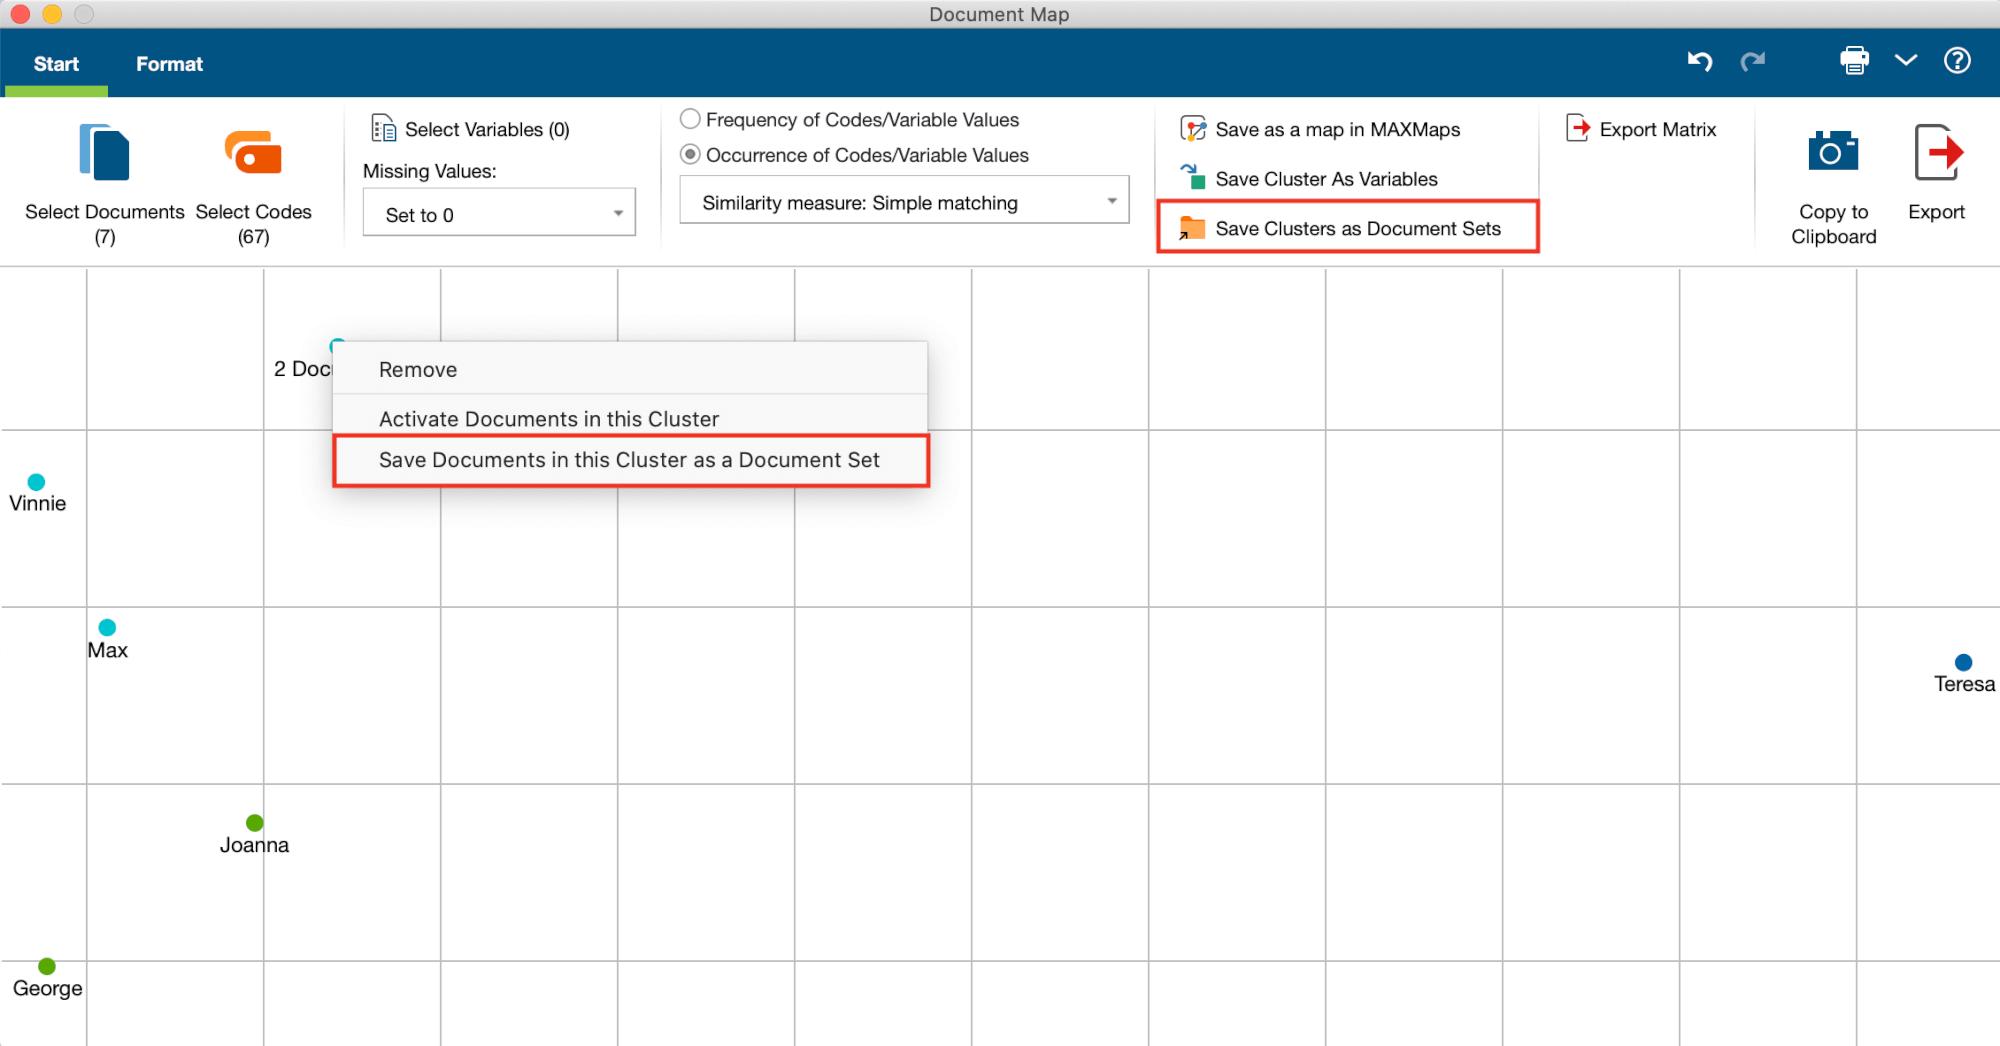 Clusters of documents in Document Maps can be saved as Document Sets.
Discover more!
For a complete list of new features and improvements, please look at the release notes for MAXQDA’s 2020.4 update. You may notice that we have taken your feedback into consideration and that we’re constantly developing new features for our software to make it even better: your input is very important for us, and we are looking forward to many more exciting features in future versions of MAXQDA.


