We are proud to present the MAXQDA 2020.3 update with a series of improvements, fixes and new features! We are continuously developing MAXQDA to make your research with MAXQDA even more enjoyable. Below are a few highlights of the latest update, but you are welcome to have a look at the complete list of improvements here.
How to update MAXQDA 2020
To install the update, follow these three easy steps:
- Open MAXQDA 2020 with a stable internet connection.
- Select the “?” query symbol in the top right-hand corner of the screen,
- And select “Search for Updates” from the menu.
MAXQDA will then install the new update and you can access the following new features and many more improvements for free! If you are using one of your institution’s computers and have limited admin rights, please contact your local administrator.
Heatmap
Visualize code distribution across your data
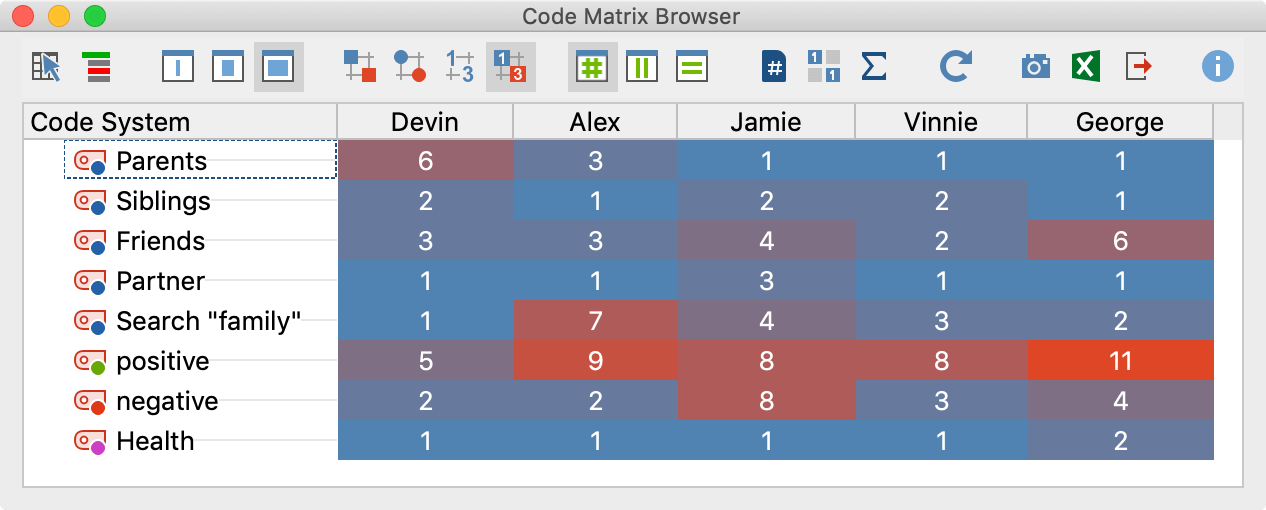
MAXQDA introduces a new technique to visualize frequencies in the Code Matrix Browser and the Code Relations Browser: the heatmap.
Instead of squares, circles or numbers, you can now display individual values in the same colors that the square or circle would have and write the number on it. This allows portraying the magnitude of the research phenomenon in colored clusters making striking values, behavioral patterns and emerging trends easily recognizable. You can use it not only as a means to gain valuable insights and ideas for further research, but also as an effective presentation tool for interpreting and supporting research results. It is especially helpful for large data sets.
Diagram designs and axis settings
New color schemes, design, and axis options for diagrams
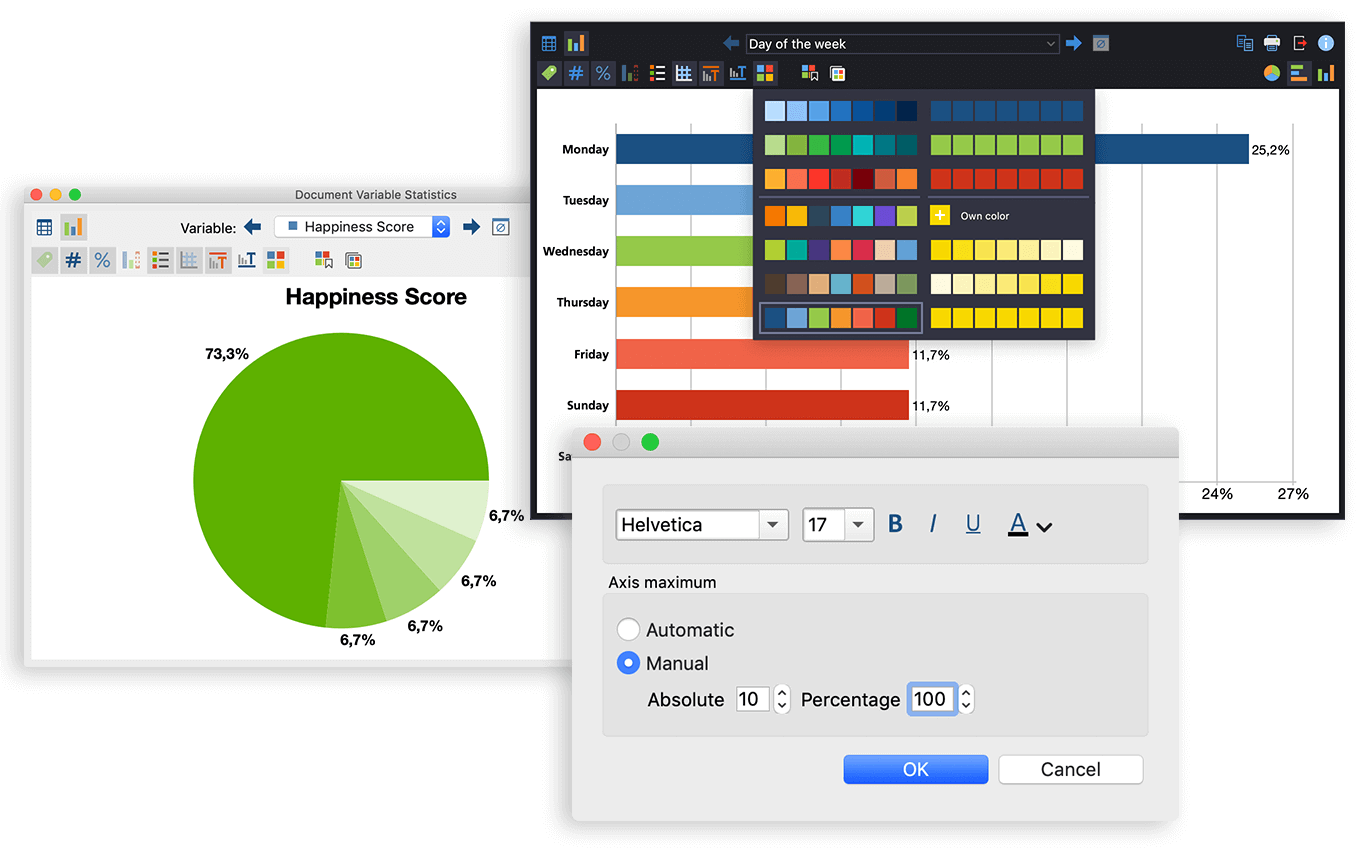
This update includes new design and axis settings for diagrams in Document/Code Variable Statistics and Stats, which offer more intuitive and flexible handling of diagrams.
You can now edit every single visualization element separately with a double-click, save the selected design settings as default, and apply those settings to any other diagrams within a project and beyond. Additionally, diagrams now offer beautiful and customizable color scheme options that match the color palette used elsewhere in your MAXQDA project. You can opt to use a color in ascending shades, descending shades, or as full color.
HappyScribe Import
Additional Source for Transcript Import
MAXQDA 2020 added the option to import transcripts from a large number of popular transcription services and tools. With the MAXQDA 2020.3 update, we have expanded the number of services you can use by adding a designated import option for HappyScribe. This allows you to work with the automatic transcription service of your choice, import your final transcript into MAXQDA 2020, and link the transcript to the media file via timestamps.

Word Cloud Lemmatization
Group words together by their base form
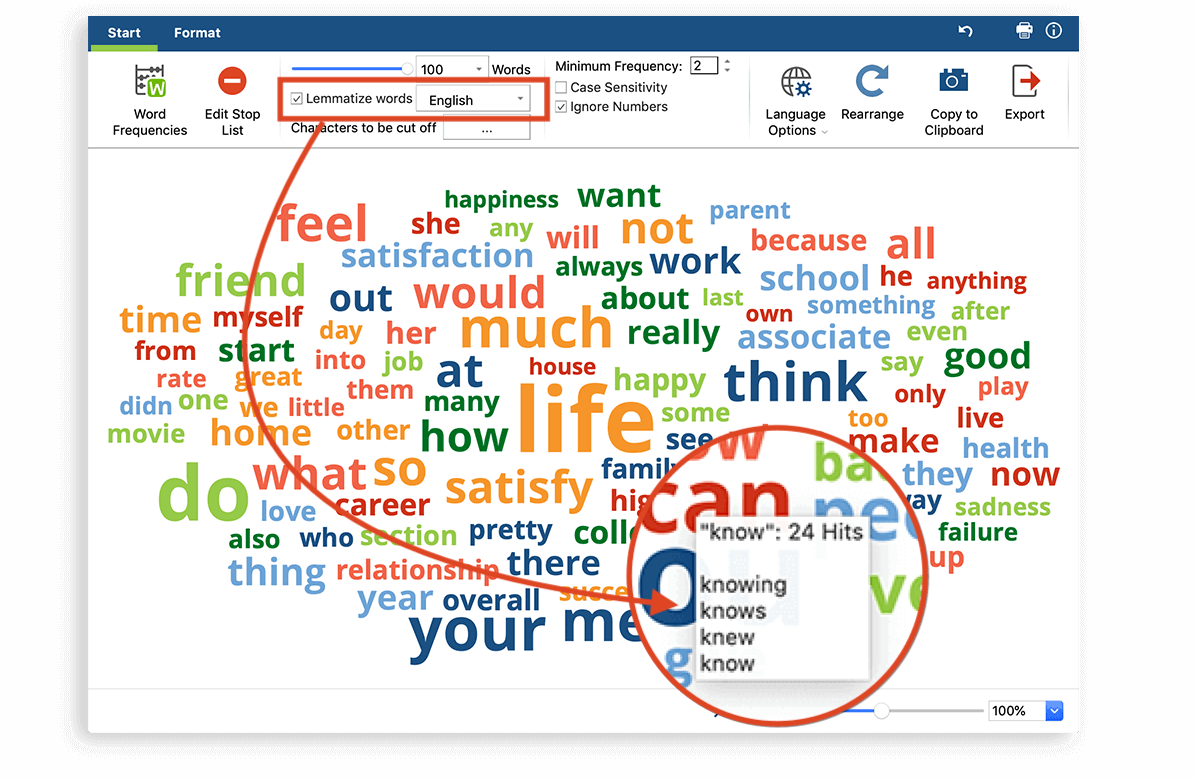
Have you ever wished that similar words in your Word Cloud were removed or consolidated so that you could have more space for other words? Now you can lemmatize words in a Word Cloud to reduce similar words to their stem or a common base form. For example, compare these two word clouds created with the same data set – the left one shows words without lemmatization, while the second one on the right contains words clustered by their roots. To view which words are clustered together, you just need to hover over a word in your Word Cloud. You can definitely visualize more meaningful key words in a lemmatized Word Cloud!
There’s more!
See the complete list of the new features, improvements, and fixes in the Release Notes. You may even find that one of your suggestions made its way into the free update! If you are currently working with an older version of MAXQDA, please see all the upgrade information as well:

