The #1 mixed methods software with the best AI integration
MAXQDA streamlines your data analysis with automatic transcription, powerful analysis tools, ease of use, and smart AI integration. Explore the possibilities now.

Why MAXQDA

Thanks to the self-explaining interface, you will quickly find your way around. Numerous tutorials, guides, and webinars, as well as an active community, help you dive deeper into MAXQDA.

One license, two operating systems. The identical interface and functions make teamwork and teaching with MAXQDA easy. Decide flexibly what you want to work with.

MAXQDA AI Assist and MAXQDA Tailwind allow you to access to advanced AI-driven functions. Enhance your research while maintaining the highest standards of data protection and control over your analytical work.

Every feature in MAXQDA is purpose-built, tested, and applied to state-of-the-art research workflows before it is brought to you.

MAXQDA constantly gets better. Every 2-3 months, we release updates adding new tools and improving features for you. Our software keeps you always one step ahead in your research.

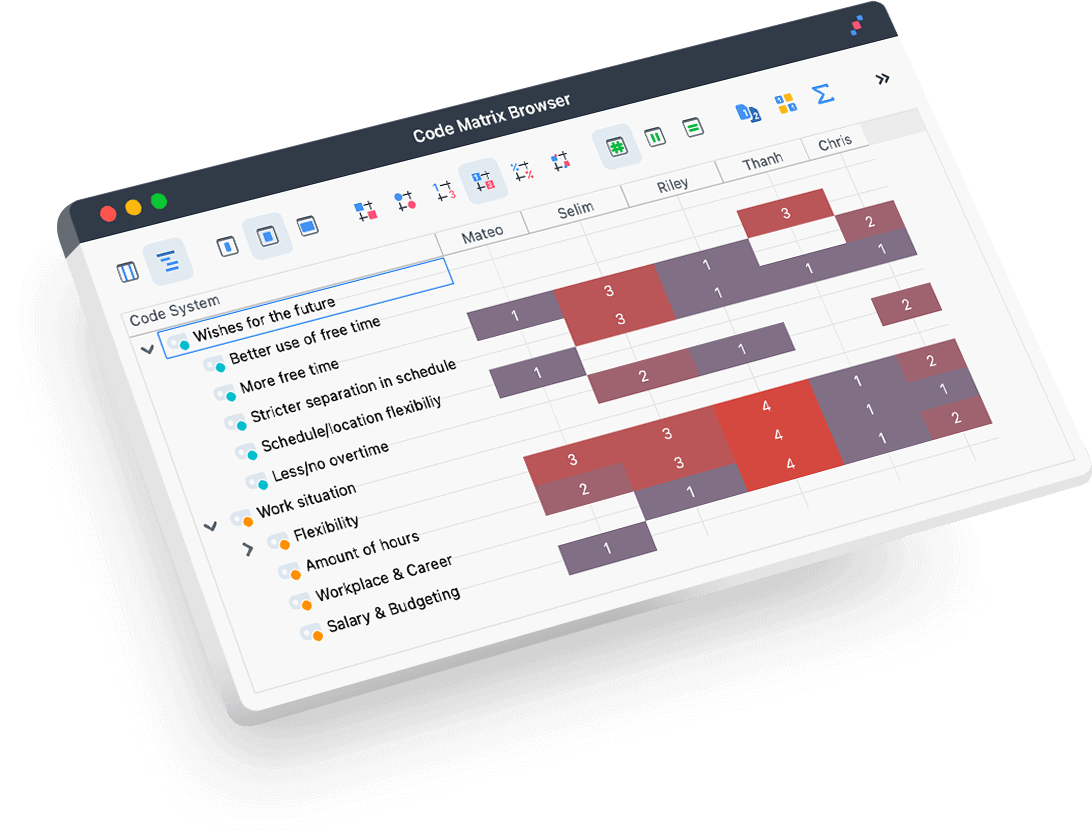
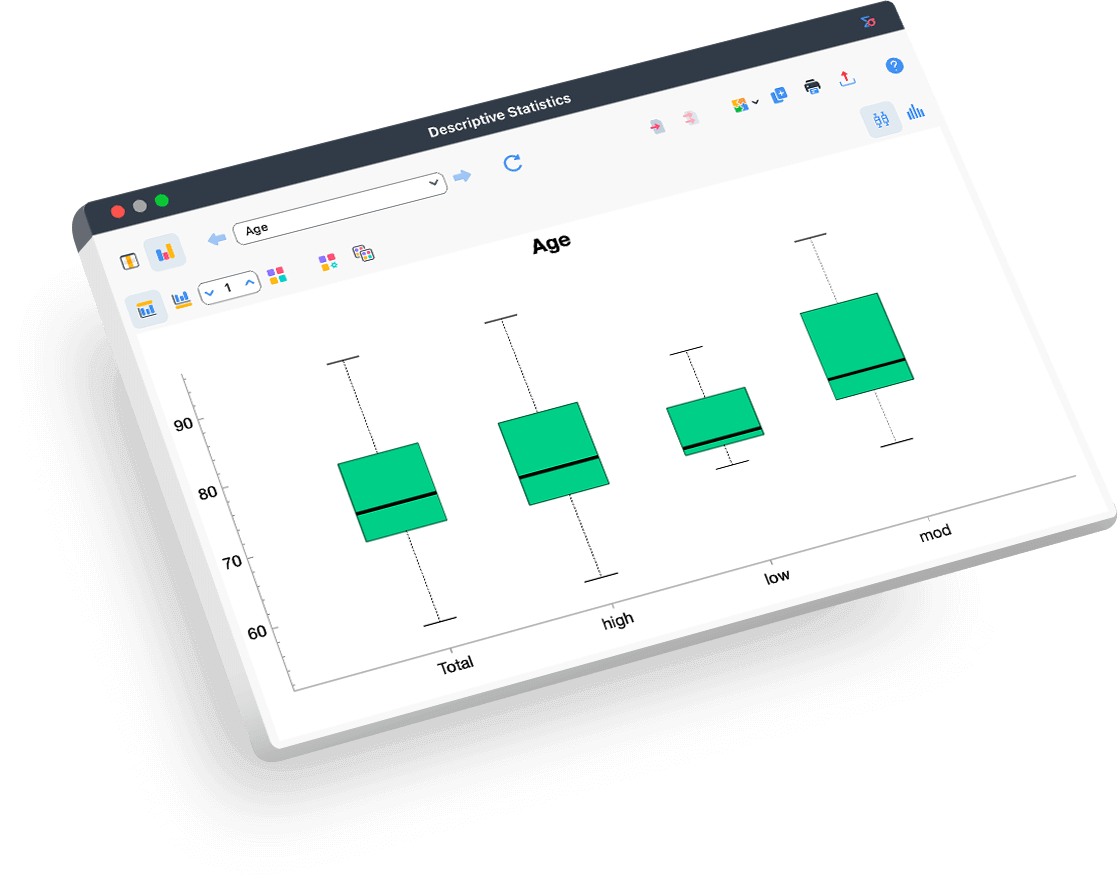
Stunning visualisations, the convenient report generator and your QTT workspace to integrate your results make MAXQDA the best choice for fast report-ready data.
Trusted by leading institutions and businesses

Having used several mixed methods software programs, there is no doubt in my mind that MAXQDA has advantages over all the others. In addition to its remarkable analytical features for harnessing data, MAXQDA’s stellar customer service, online tutorials, and global learning community make it a user friendly and top-notch product.Sally S. Cohen NYU Rory Meyers College of Nursing

I spent several months researching the options, and ultimately decided to trial MAXQDA. We brought in a MAXQDA certified trainer, and bought a network license so that our large team at Microsoft could use the tool. We were not disappointed[…] I was so convinced in its efficacy in the applied qualitative field that I bought MAXQDA for my team when I joined Amazon. I was especially delighted when they added the Stats package, which allows us to avoid the extra expense of buying SPSS.Sam Ladner, Ph.D. Former Senior Principal Researcher at Workday

I have been fascinated by qualitative research as it makes us reconsider reality from a new perspective. For such reconsideration, it is essential to read data from various viewpoints and write your ideas in notes and memos, continuing to renew your perspective. I have found MAXQDA to be an excellent tool for readily recording and organizing ideas that come up with at various stages of research […]. More than that, however, I feel the potential of MAXQDA is to promote dialogue within the researcher and facilitate new discoveries.Masahiro Nochi Graduate School of Education, The University of Tokyo

Understanding and analyzing production and work processes – that’s an important part of my work at Fraunhofer Institute for Factory Operation and Automation IFF and MAXQDA supports me in this. MAXQDA convinced me with its versatility, the intuitive design and the ability to work together in a team across the board. In our interdisciplinary projects with innovative companies, we can thus achieve an effective and efficient way of working.Sebastian Häberer, M.Sc. Expert Engineer, Fraunhofer IFF

With MAXQDA I saved a lot of time coding my research interviews, and with the Visual Tools I was able to show the results in a clear and simple way. MAXQDA has the advantage that it is very intuitive and therefore easy to learn and handle. In addition, they listen to users and provide continuous updates to improve the experience.Luis Daniel Vazquez Cancino PhD candidate in Architecture from the National Autonomous University of Mexico
Mixed Methods Research is Faster and Smarter with MAXQDA
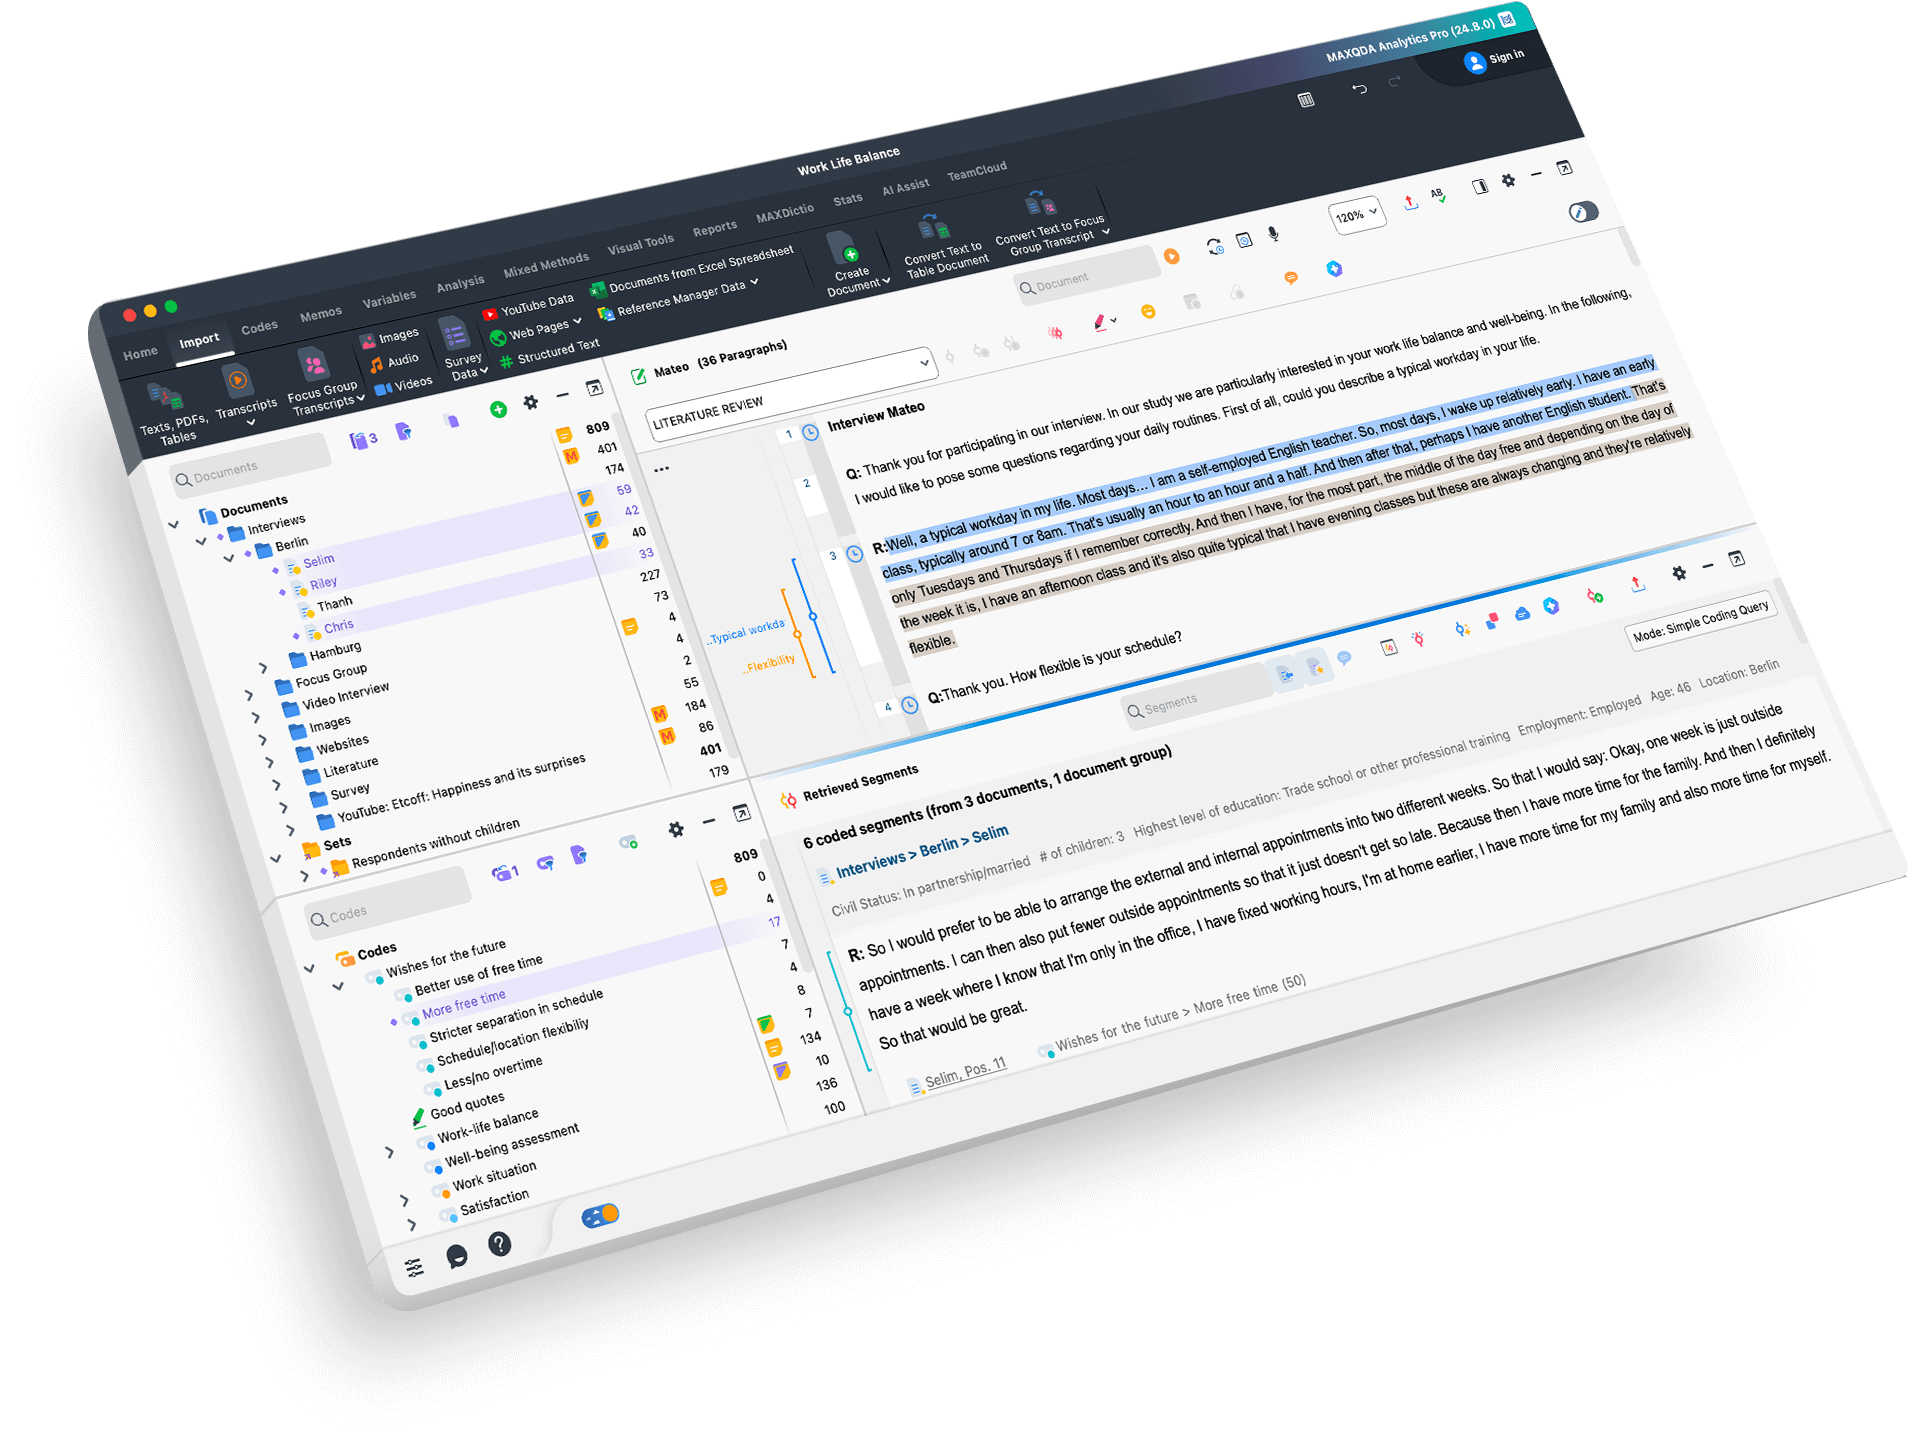
MAXQDA makes qualitative data analysis faster and easier than ever before. It offers a wide range of analysis methods, including Grounded Theory, qualitative content analysis, group discussions, discourse analysis, Mixed Methods, and case and field studies. Its user-friendly 4-Window Interface provides quick access to powerful tools and functions, streamlining the data analysis process. Additionally, MAXQDA is the only leading Qualitative Data Analysis software that is 100% identical on Windows and Mac, providing a consistent and seamless analysis experience.
All-in-one Mixed Methods Software
MAXQDA is the ultimate mixed methods software, with its ability to seamlessly import all types of qualitative data making it the perfect tool for managing and analyzing your research project. With MAXQDA, you can easily import a wide range of data types such as text, interviews, focus groups, PDFs, web pages, spreadsheets, articles, e-books, bibliographic data, videos, audio files, and even social media data. Organize your data into groups, link relevant quotes to each other, use MAXQDA’s powerful tools to facilitate your qualitative analysis, and share and compare work with your team members. The project file stays flexible allowing you to expand and refine your category system as you go, ensuring your research is tailored to your needs.

User-Friendly Tools for Qualitative Coding
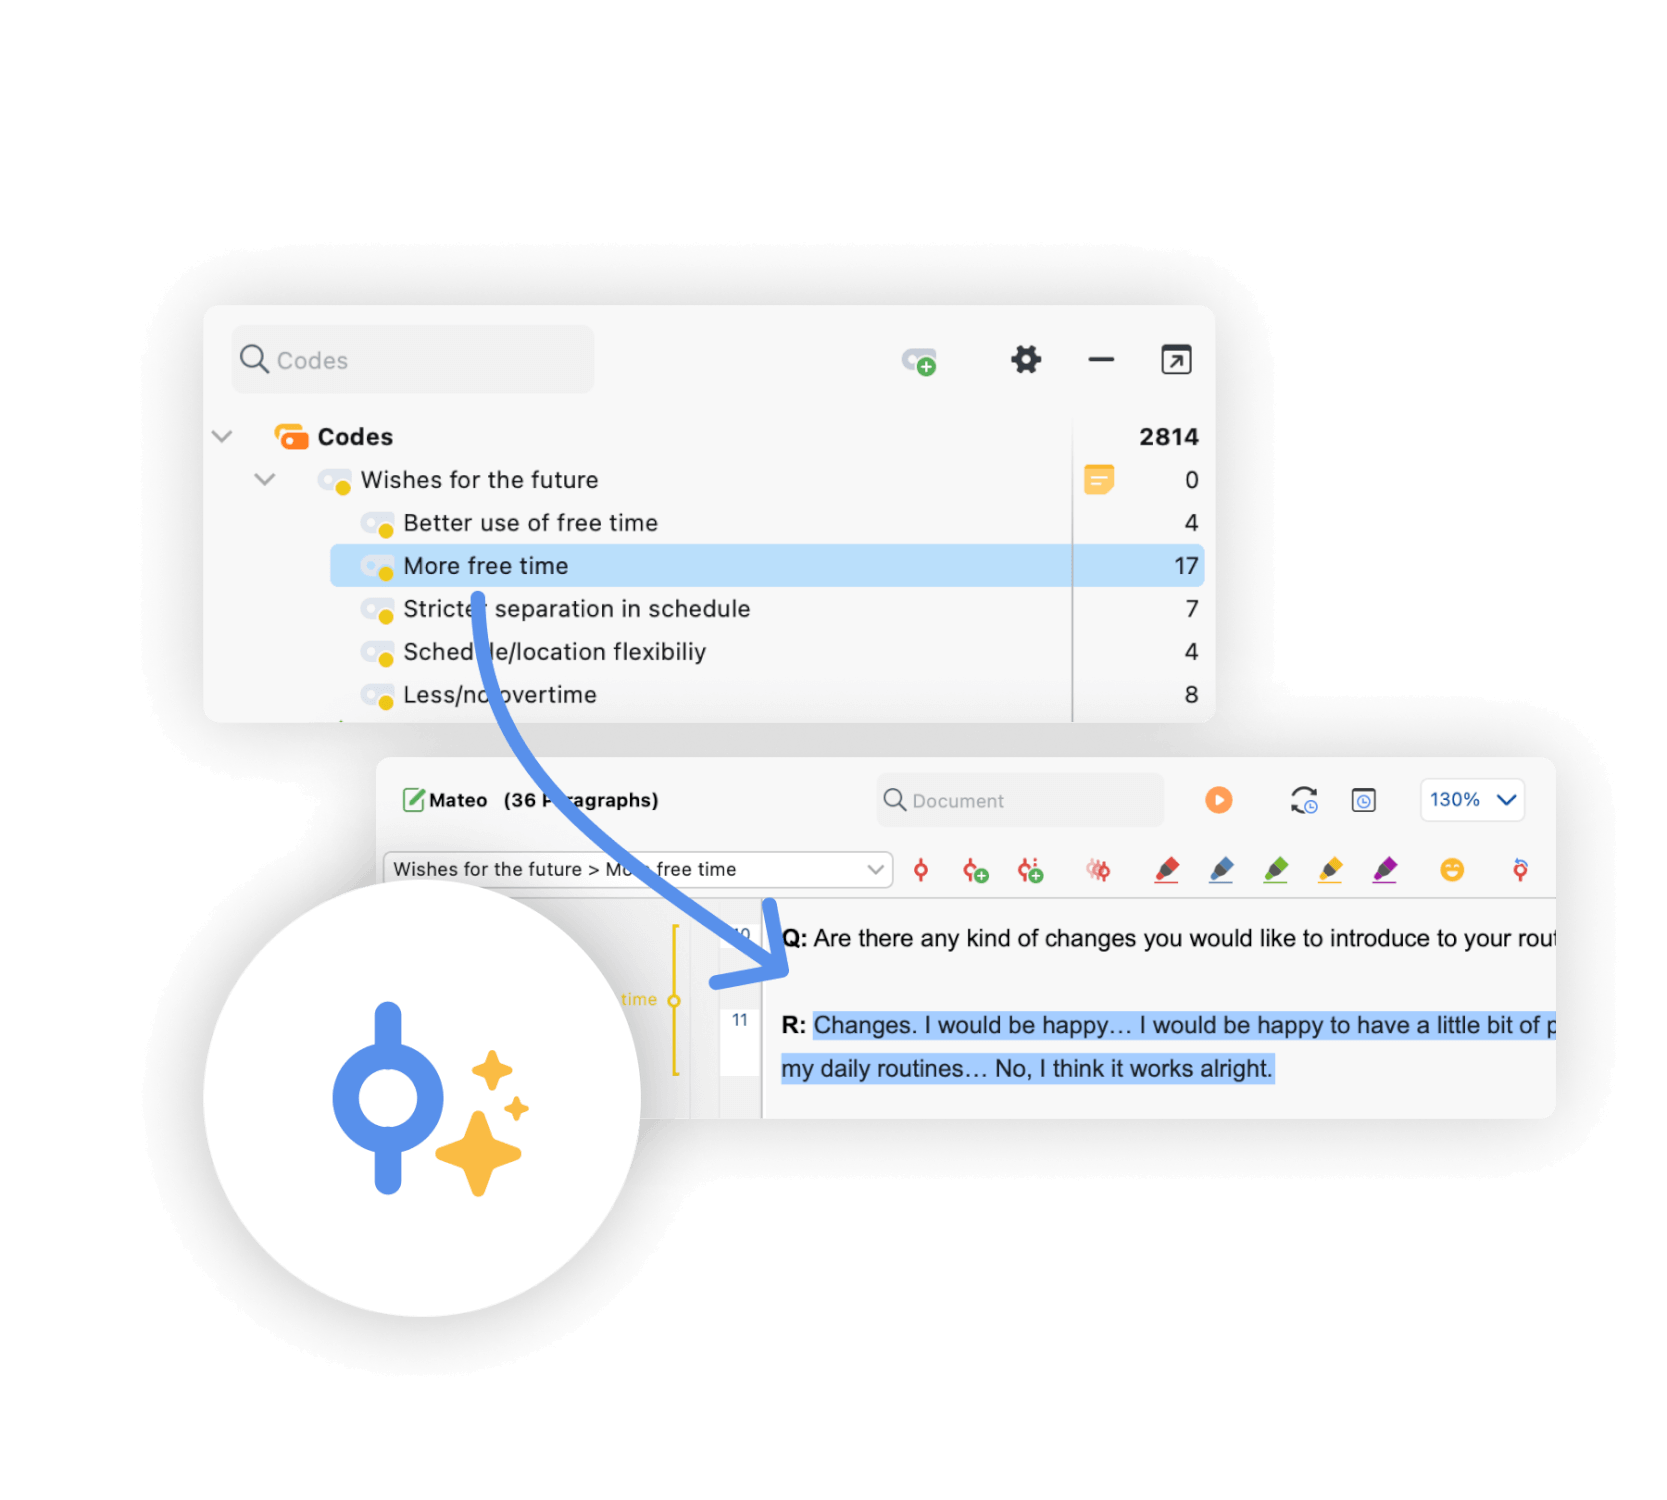
Utilize a variety of tools such as codes, colors, symbols, and emoticons to mark important information in your data. With MAXQDA, you can create codes with just one click and apply them quickly via drag & drop. The software’s Text Search tools allow you to explore your material without coding or reading them first. You can also search for keywords and automatically code them with just a few clicks. Organize your thoughts and theories in memos that can be linked to any element of your project. Retrieve your coded segments with one click or use MAXQDA’s powerful summary tools to test and develop new theories. Make the most of your time with MAXQDA, the #1 mixed methods software
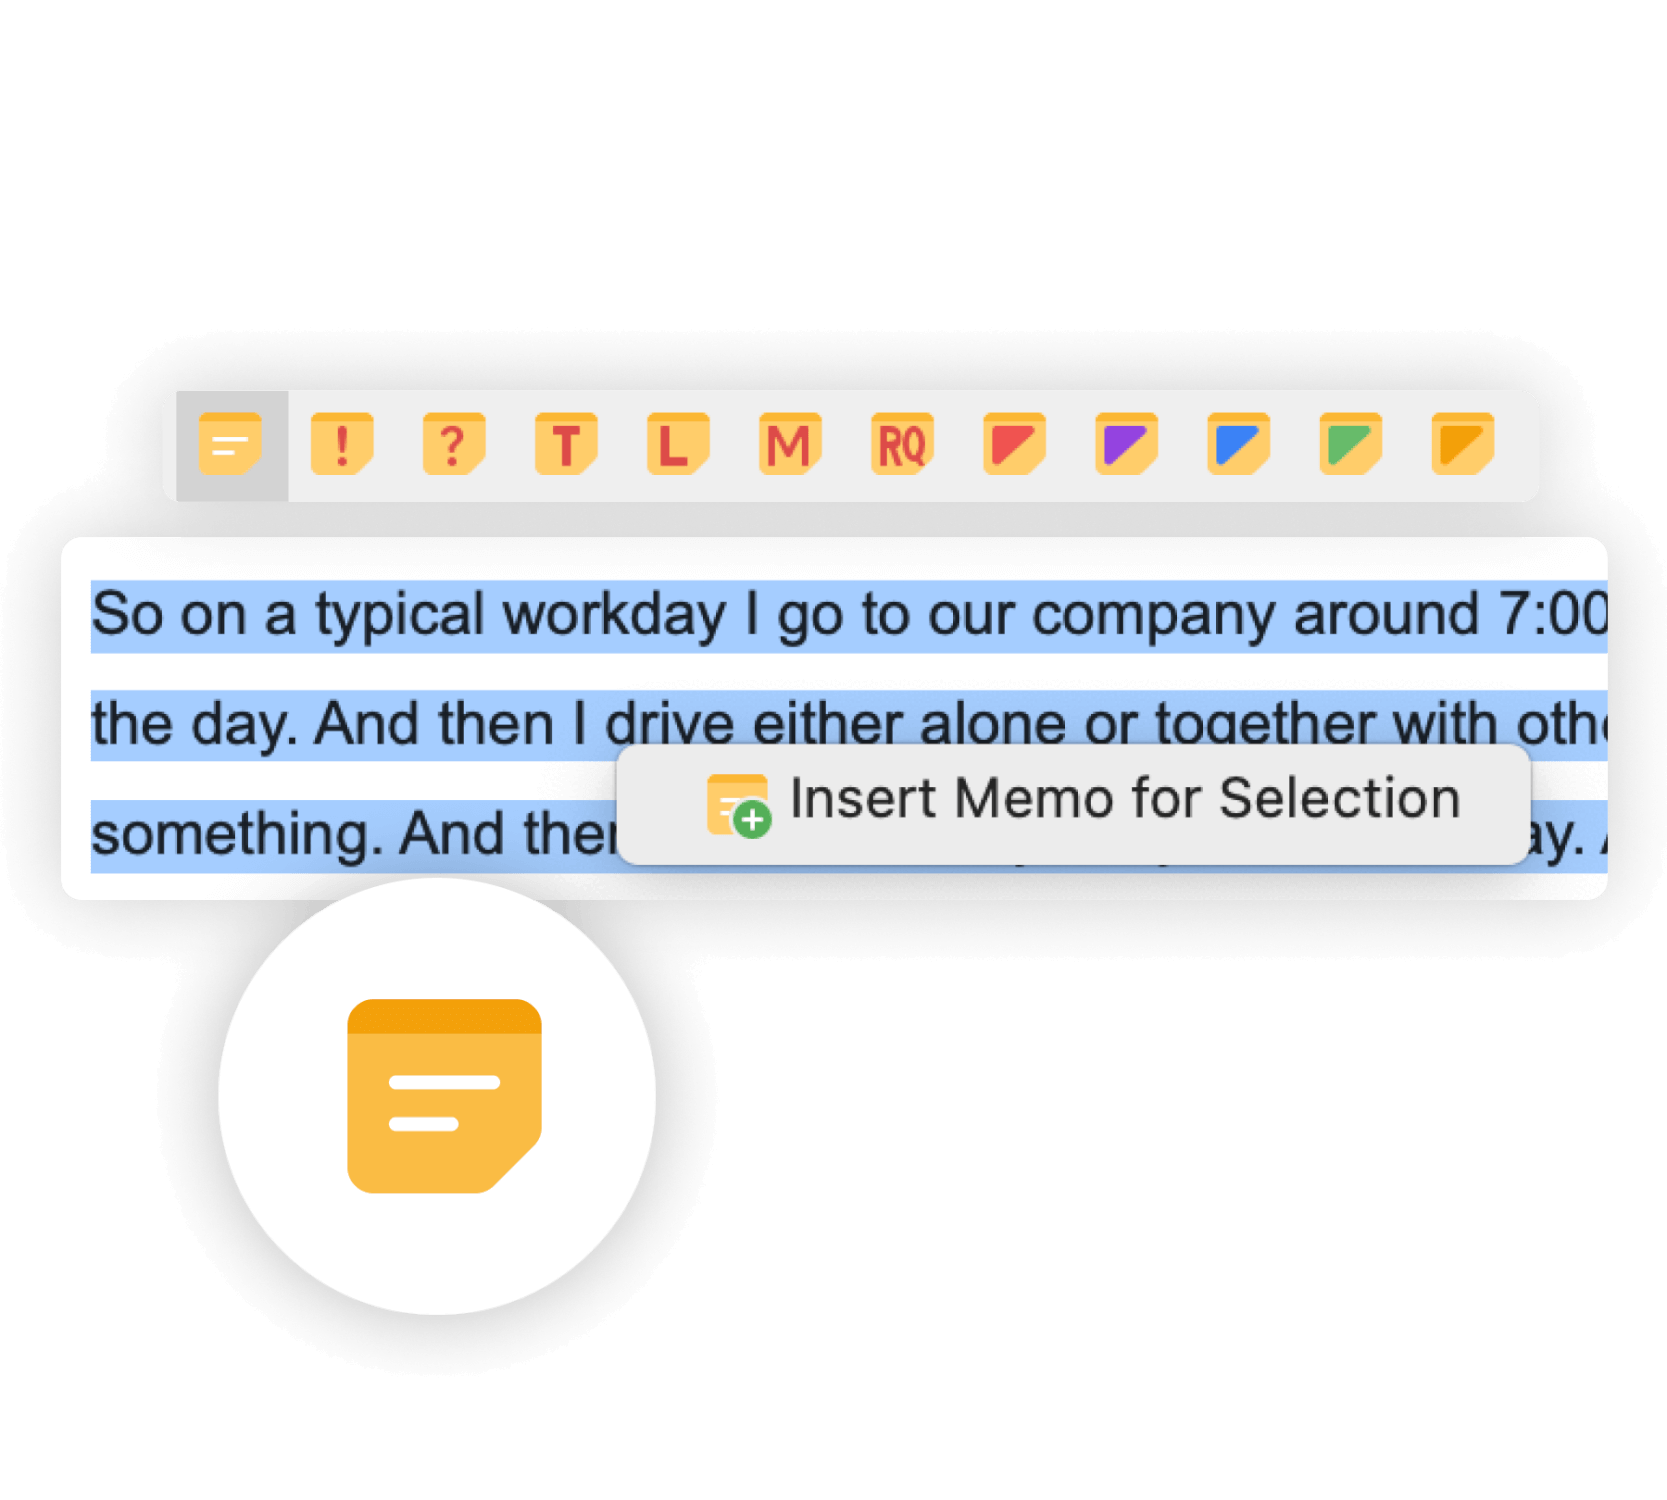
Organize Your Qualitative Data with MAXQDA’s Memo Tools
As you perform your qualitative analysis, MAXQDA allows you to capture ideas and insights by creating memos to store research questions, objectives, and paraphrasing passages into your own words. The software’s memo feature also allows for easy creation of audit trails by attaching memos like post-it notes to text passages, texts, document groups, images, audio/video clips, and codes. With the unique MAXQDA memo manager and lexical search function, you have immediate access to every single memo at any time, making it easy to stay organized and on top of your research. With MAXQDA, the leading mixed methods software, your data organization is made simple.

AI Assist: MAXQDA meets AI
AI Assist – your virtual research assistant – supports your work with various tools. Besides automatic transcription of audio and video recordings in different languages, AI Assist simplifies your work by automatically analyzing and summarizing elements of your research project and by generating suggestions for subcodes. No matter which AI tool you use – you can customize your results to suit your needs.


