The foundation of some of the unique new MAXQDA Visual Tools is that researchers can now assign more than 1,000,000 different colors to codes. Thus MAXQDA provides the researcher with powerful features supporting the data exploration, enabling (intermediate) insights, as well as displaying data results.
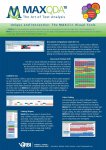
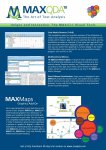 Click on the pictures for a detailed view Text Comparison Chart (TCC)
Presents with a single mouse click a striking picture, comparing different texts at a glance. The researcher is completely free to decide which codes and texts should be included in the comparison.Text Portrait (TP)
The Text Portrait is a graphic, displaying a selected text as a „painting“ of either all or specific, selected codes assigned throughout the text. The screenshot shows that Cathy has a lot to say about financial issues (orange), but very little about family background (red). You may change the assignement of colors at any time throughout your analytical process.Codeline (CL)
The Codeline picture offers a fast and comprehensive view of the codes assigned to a text. The diagram is interactive; as soon as you click on a symbol in a cell of the matrix, the text passage shows up in MAXQDA’s TEXT BROWSER.Color-Coding Stay with your proven routines: the MAXQDA Color-Coding allows for recording text segements just like using a textmarker on paper work for the first non-interpretative reading.Control of Colors and Coding Stripe Colors MAXQDA now offers more than 1,000,000 colors, which can be assigned to codes, subcodes, and texts. Color assignments are user-controlled and can be used functionally, not just merely an aesthetic accessory. All color stripes can be set to invisible (e.g. you can hide codings from another team member or from a specific code).Code-Matrix-Browser (C-M-B)
The matrix enables a completely new way of visualizing the distribution of codes throughout a researcher-driven selection of texts. You will appreciate the easy and intuitive handling of the Code-Matrix-Browser. The matrix provides an overview of how many text segments from each text have been assigned a specific code.10 Different Memo Types A range of memo symbols allow for defining different types of memos (e.g. theoretical memos, literature memos, etc.). All memos are accessible at any time in the MAXQDA Memo Manager. Every memo is displayed in your MAXQDA project like a “Post-It”. Just double-click to open it.MAXMaps – The Graphics Add-On Get a new perspective on your data and on the results of your analysis! MAXMaps, the multi-functional graphics tool of MAXQDA, allows for displaying your analytical process and its results in constant “live” connection to your data. Moreover, you may use the tool completely independently of your database in order to illustrate any given process, hypothesis or pattern in a graphic or diagram while allowing the reseracher an outstanding level of free creativity. Similar to MAXQDA and the content analysis add-on MAXDictio, MAXMaps is outstanding in its user-friendliness in terms of flexibility and intuitive handling.
