Once again we are delivering on our promise to continuosly develop our software and provide innovative solutions for qualitative and Mixed Methods researchers. With this free update for MAXQDA 12 we are implementing a completely new feature set for the creation of Joint Displays. Joint Displays are visualizations and tables that integrate data and/or results from both a qualitative and a quantitative database commonly used in Mixed Methods research.
This latest update also brings new features to the Visual Tool “Codeline”, text search and many general improvements for your research workflow.
If you have deactivated automatic notifications for new updates, you can search for this update in MAXQDA with “Help > Search for update”.
5 Types of Joint Displays
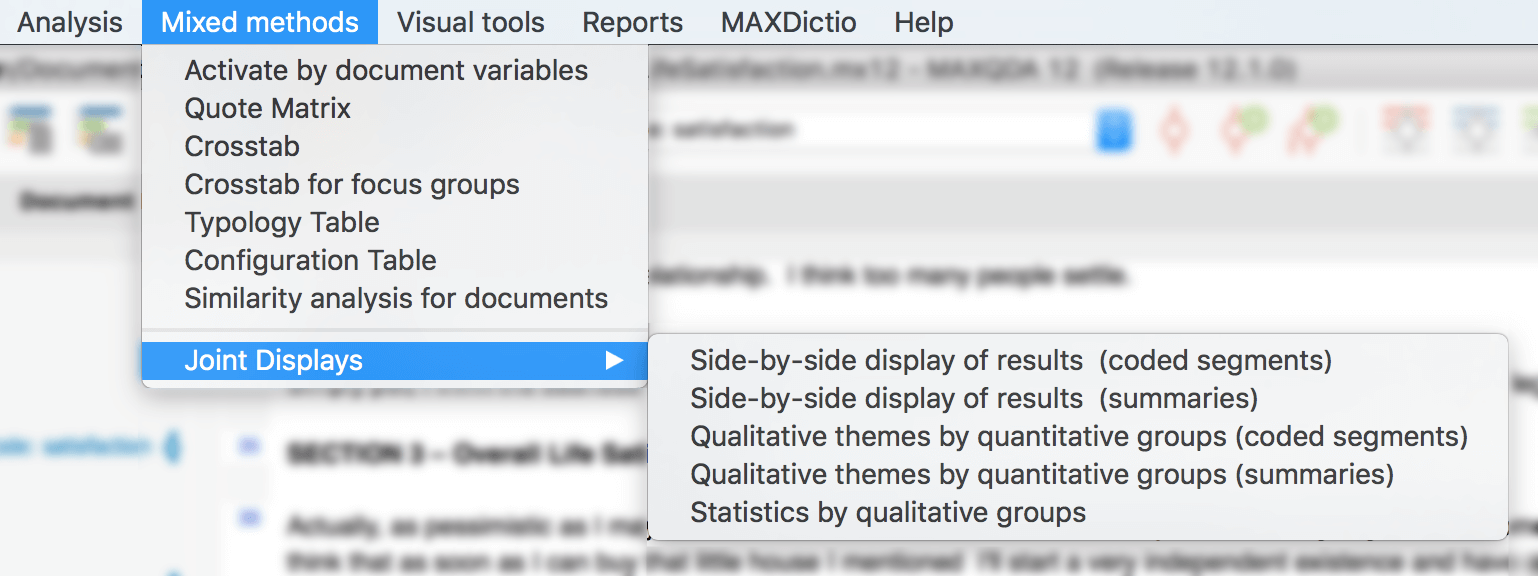
Check the “Mixed methods” menu in MAXQDA 12.1. to find a completely new set of features for Joint Displays.
1. Side-by-side display of results (coded segments)
Compare results of a qualitative and a quantitative study in a table that contains coded segmens for selected themes
2. Side-by-side display of results (summaries)
Compare results of a qualitative and a quantitative study in a table that contains summaries for selected themes
3. Qualitative themes by quantitative groups (coded segments)
Group documents by document variable values and compare each groups coded segments for selected themes in a table
4. Qualitative themes by quantitative groups (summaries)
Group documents by document variable values and compare each groups summaries for selected themes in a table
5. Statistics by qualitative groups
Group documents by codes that were assigned to the document and compare mean, standard deviation, frequency and percentage of selected variables
Visual Tools: New Codeline features
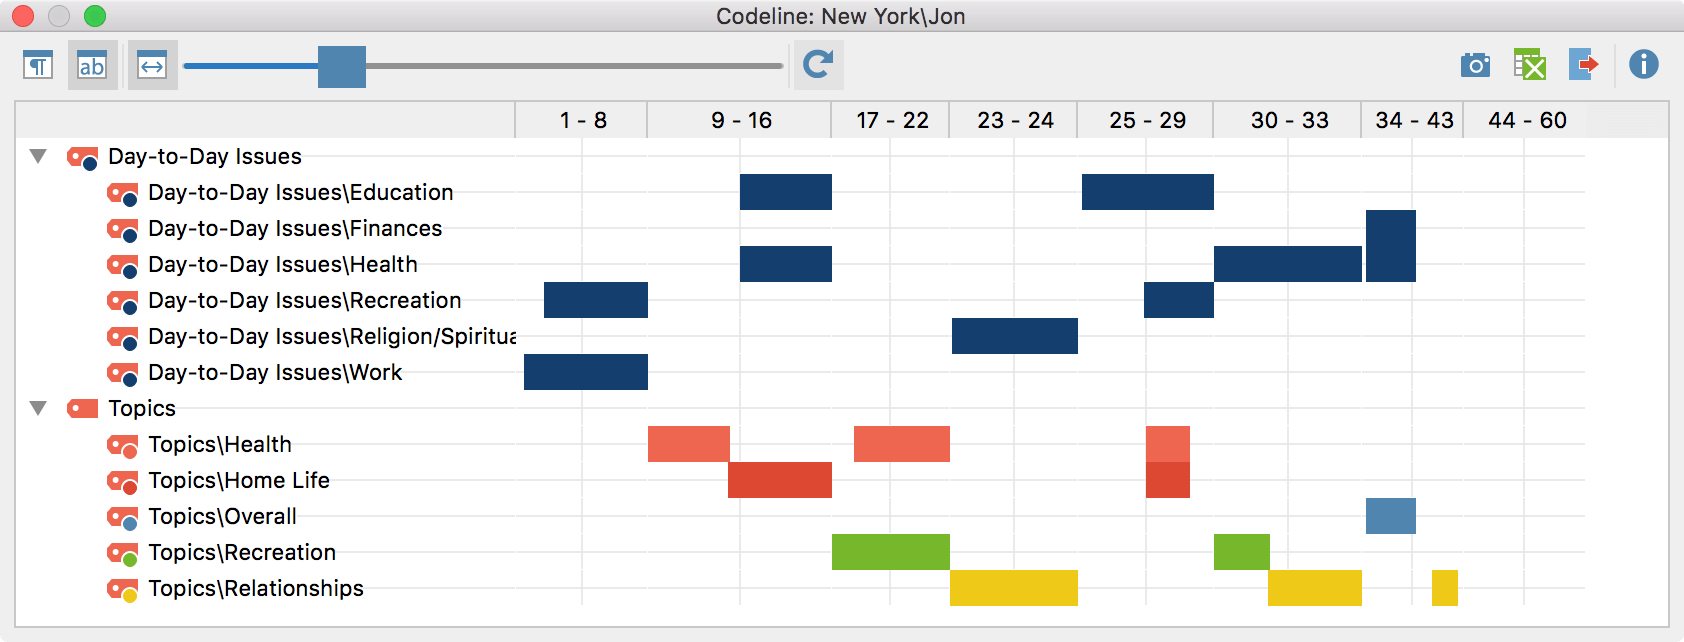
- More options: Display length of codes based on number of paragraphs or number of characters that have been coded
- New aggregated view fits the whole codeline into your windows. Perfect for publications and presentations
- New slider to adjust column width
- New filter option: Limit visualization to coded segments with a certain weight
Visual Tools: General Improvements
- New camera icon takes a screenshot of the currently visible area and copies the image to the clipboard. You can insert it into a presentation or report via cmd+V
- New eÉxcel export icons for Document Comparison Chart and Codeline
- Click a code in the “Code System” to highlight it on a Map in MAXMaps
MAXDictio: Lemmatization and Split Word Frequencies by Document Groups
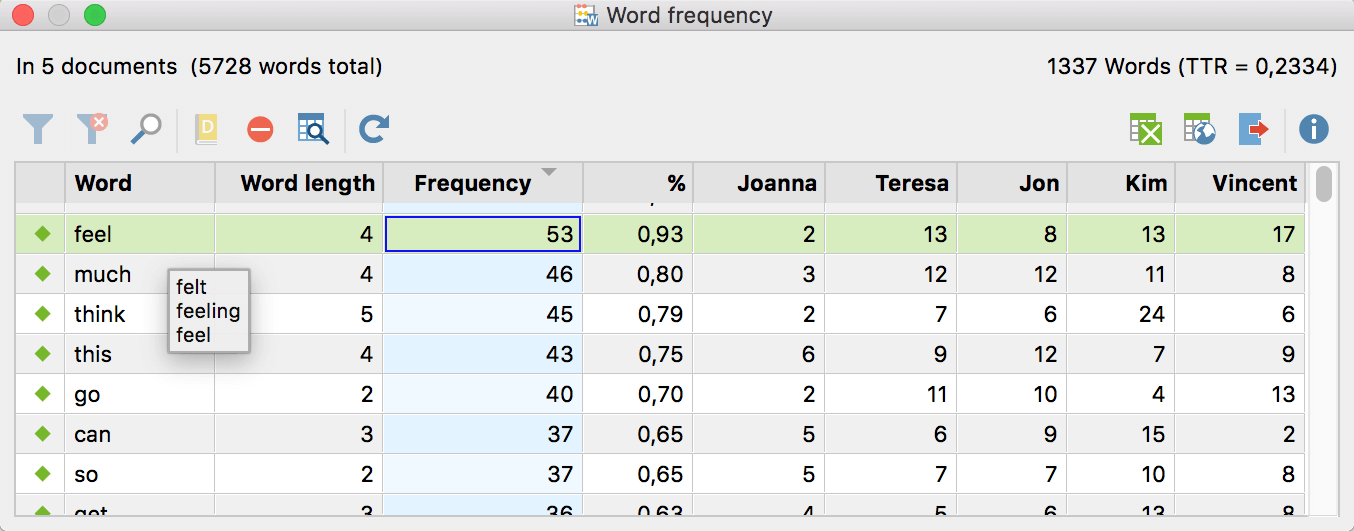
Word frequency results table – the count of “feel” also includes “felt” and “feeling”
- Stemming and Lemmatization is coming to MAXDictio! Different forms of a word (car, cars, car’s) can be grouped together in the word frequency results table. Available for these languages: Bulgarian, Catalan, Czech, English, Estonian, French, German, Hungarian, Italian, Polish, Portuguese, Spanish, Swedish, Ukrainian
- New filter option: Analyze word frequencies by document groups
Text Search: Search Results Preview and New Extended Search Options
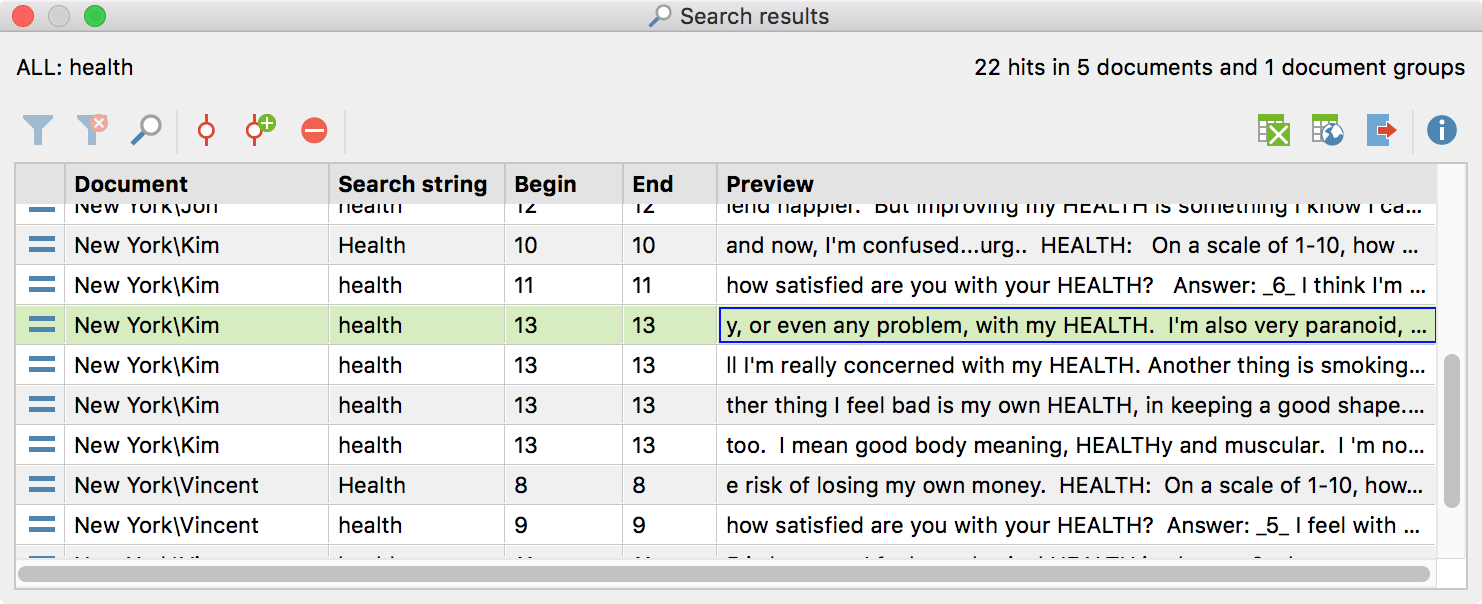
Search result tables with new “Preview” column
- Overhauled “Extended lexical search” dialog window to make room for new search options, e.g. searching for a combination of search strings across multiple sentences, pages or cells in text documents, tables or PDF files
- Search results table with new “preview” column, making it easier to evaluate the quality of each finding. Of course you can still click on a result to jump into the original document
- Search results table with new “context” column, when searching for combinations of search items displays how close or far search items are from each other (e.g. 1 paragraph or 2 sentences)
- Search results table for text search in memos: doubleclick a search term to highlight it in a memo
Creative Coding
- Save Creative Coding map as a standard MAXMap for audit trail
- New colors are automatically applied to selected codes
Coding: General Improvements
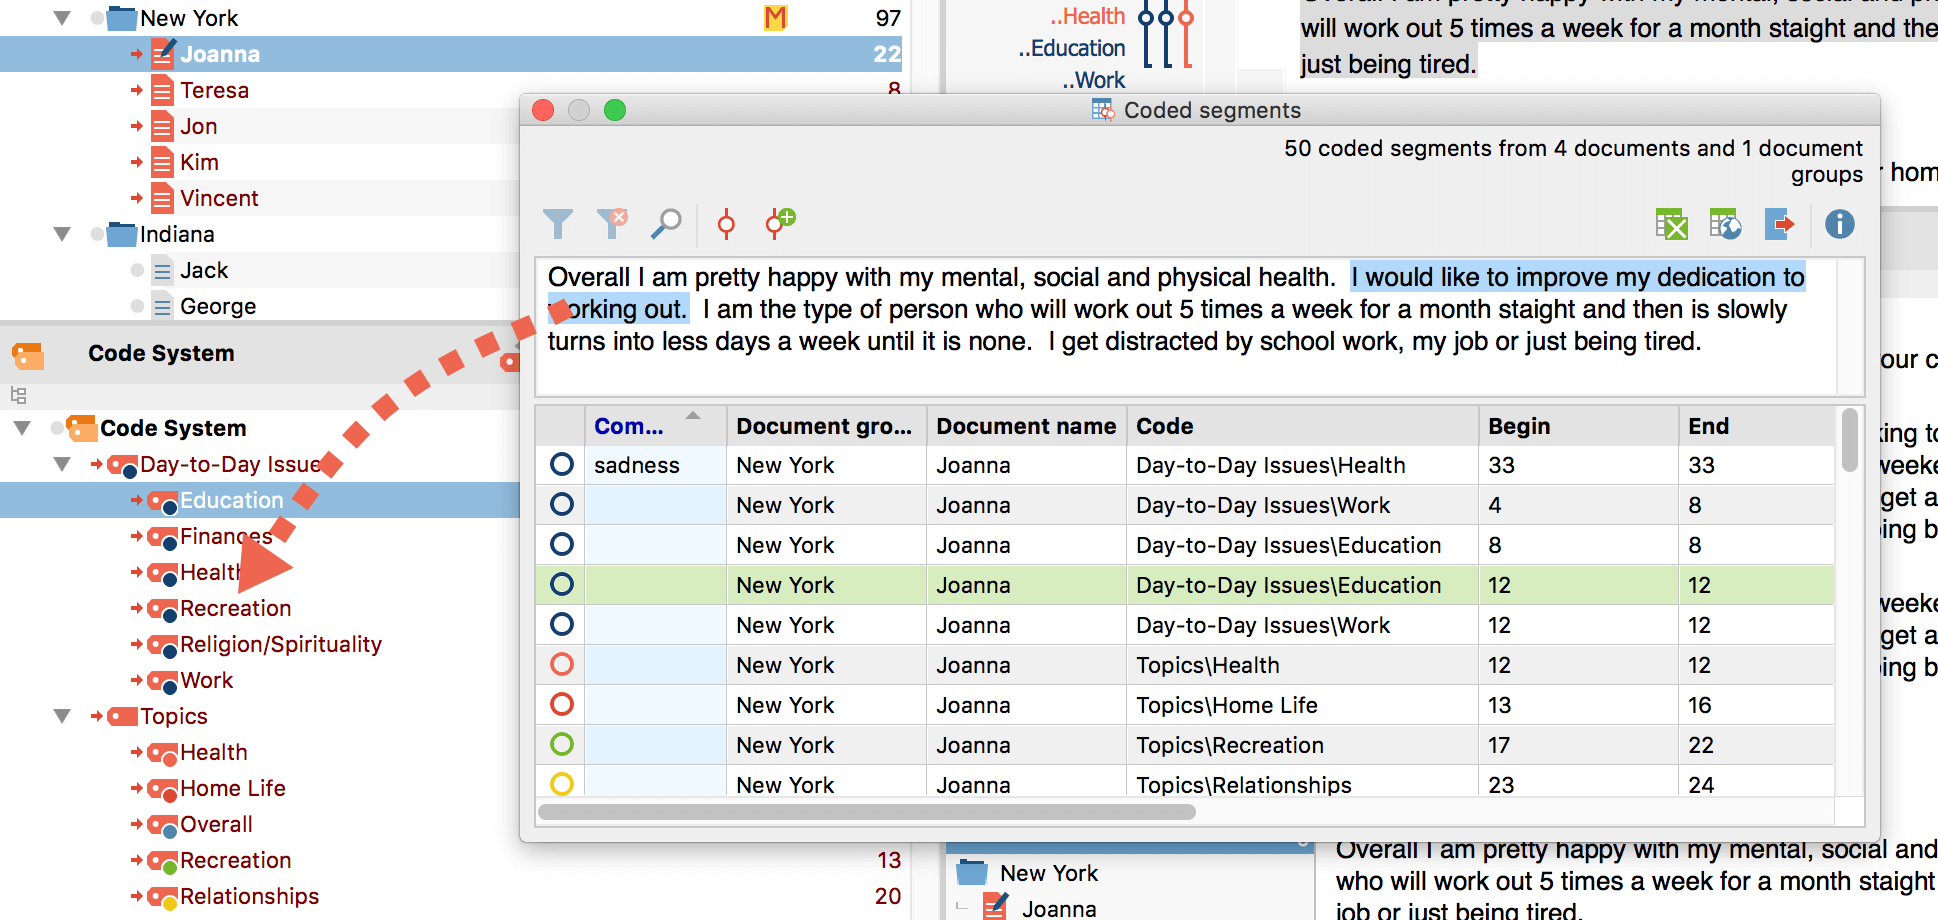
Drag & drop to code from preview windows
- You can now code text right inside the preview window at the top of the “Overview of coded segments” table. Just drag & drop a code onto the selected text segment or vice versa
- Extend a code across highlighted text by right-clicking on the coding stripe and selecting “Extend with highlighted segment”
- Smoother text selection in PDF documents
Focus Groups: Activate by Participants “Activity”
- Activate focus groups by name, number of contributions, and number of characters for easy comparison of participants who talk more and less
Document Variables: SPSS Data File Compatibility
- Import and export document variables to and from SPSS data file (*.sav) for direct exchange with statistical software
Other
- “Retrieved Segments” export includes a memos label type
- New info box for unsuccessful DOC/X import in MAXQDA for Windows
- Double-click to remove a variable condition in “Activate by variable” dialog
All of the new features in MAXQDA 12
Still working with an older version of MAXQDA? Learn all about the new features of MAXQDA 12 in our release video, published September 1st, 2015.
Try MAXQDA 12 with the free demo
Try out MAXQDA 12 today by downloading the free demo.


