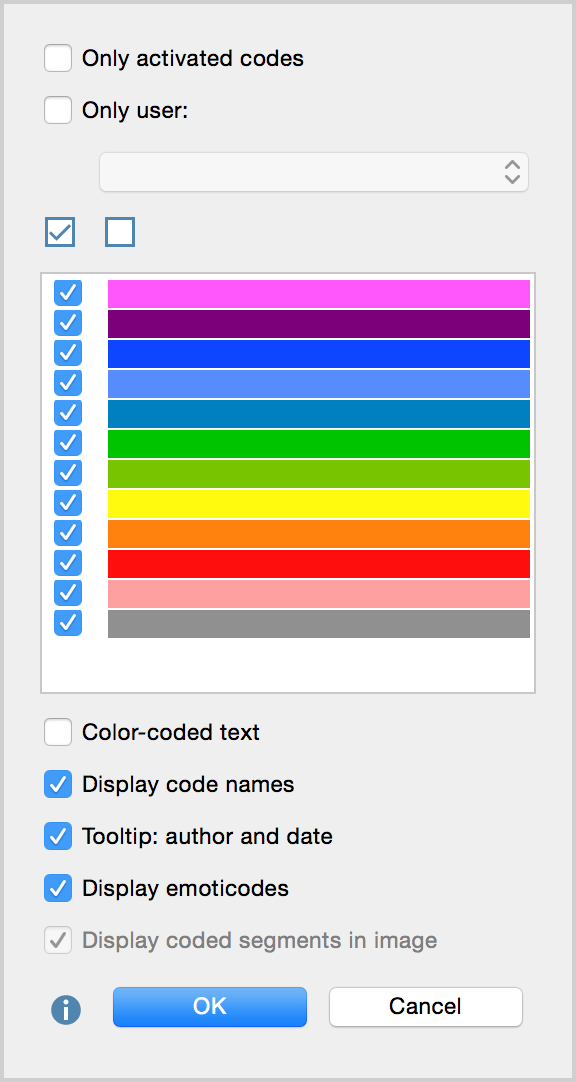
By right-clicking in the coding stripe column, you can call up a window with various settings for the visualization of coded segments in the coding stripe column:

Here you can adjust the following settings:
- You can choose to only visualize activated codes.
- You can choose to visualize coded segments created by certain users.
- You can choose to only visualize coded segments of a certain color.
- You can choose whether to change the text color of the text in the document to match the color of the code it was coded with.
- As mentioned before, you can choose whether the code name should be shown or not.
- Finally, you can choose whether the tooltips should include the information about the author and date of creation.
The option to switch off codes with selected colors is particularly useful when you are working in a team with independent coders. In this case, the coders should be defined as codes on the highest level of the code hierarchy and the different coders should use the same code tree organized as subcodes of the coders. Now, while the training the coders, you can hide the visualization of other coders’ work. Later on, they can compare their coding with the coding done by the others.
The option to color the text according to code colors only makes sense if you do not have many overlapping codes. Overlapping codes cause the color of the text to be a mix of those overlapping codes, which can make it very difficult to interpret.
