Building Summary Tables
MAXQDA Tailwind’s ![]() Summary Tables in MAXQDA Tailwind enable you to get an overview of how different topics are represented across your documents. On this page, you’ll learn how to create, manage, and interact with Summary Tables in MAXQDA Tailwind to organize and review AI-generated summaries across your documents and topics.
Summary Tables in MAXQDA Tailwind enable you to get an overview of how different topics are represented across your documents. On this page, you’ll learn how to create, manage, and interact with Summary Tables in MAXQDA Tailwind to organize and review AI-generated summaries across your documents and topics.
📚Creating a Summary Table
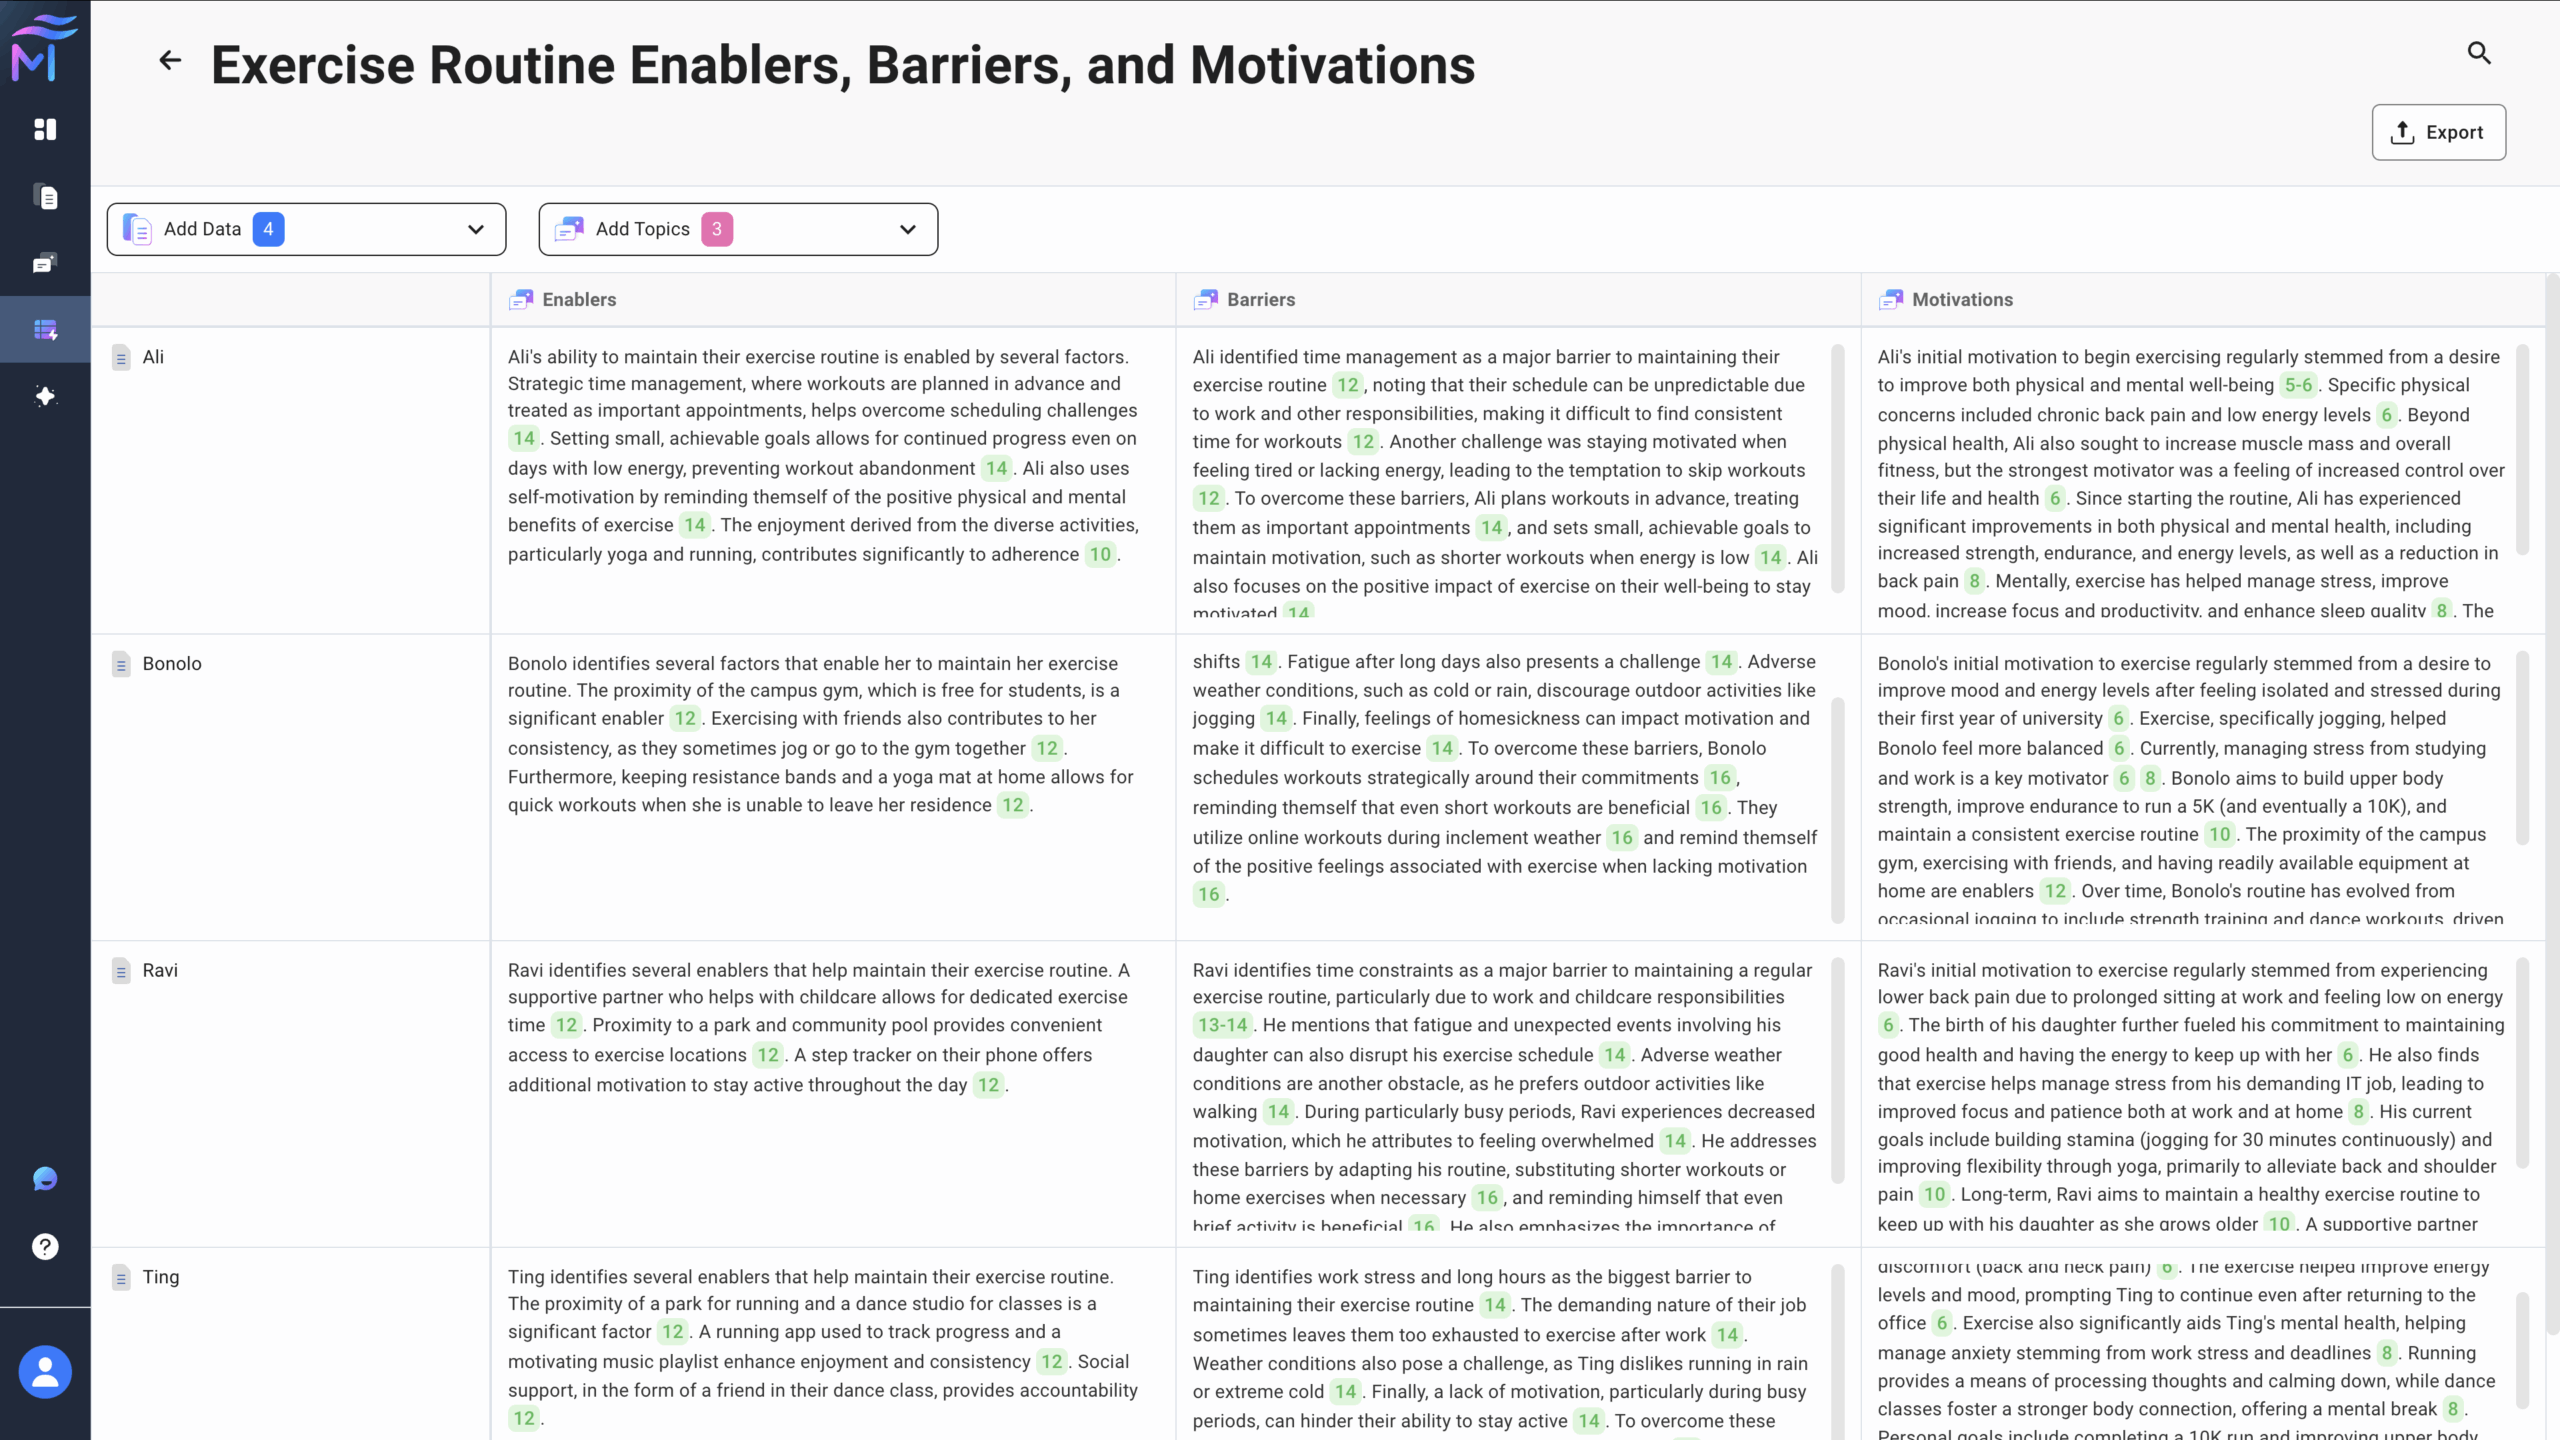
![]() Summary Tables are tables with documents as rows and topics as columns. Each cell contains an AI-generated summary that shows how a topic appears in that document:
Summary Tables are tables with documents as rows and topics as columns. Each cell contains an AI-generated summary that shows how a topic appears in that document:
Once you have imported files and created topics. To create a table:
- Navigate to
 Summary Tables.
 - Then, click + Create Table.
- Next, select the data and topics you’d like to use to populate your table.
- Click Add Data, select your files, then click Apply.
- Click Add Topics, select your topics, then click Apply.
- Click
- Once both data and topics are selected, Tailwind will automatically generate the summary table.

Tip
After you click Apply, you’ll see a blue badge showing the number of selected documents and a pink badge showing the number of selected topics.
🌍 Interacting with Summary Tables
Each cell in the summary table contains an AI-generated summary of the topic for the corresponding document. These summaries have interactive references that open the “Document View” panel:
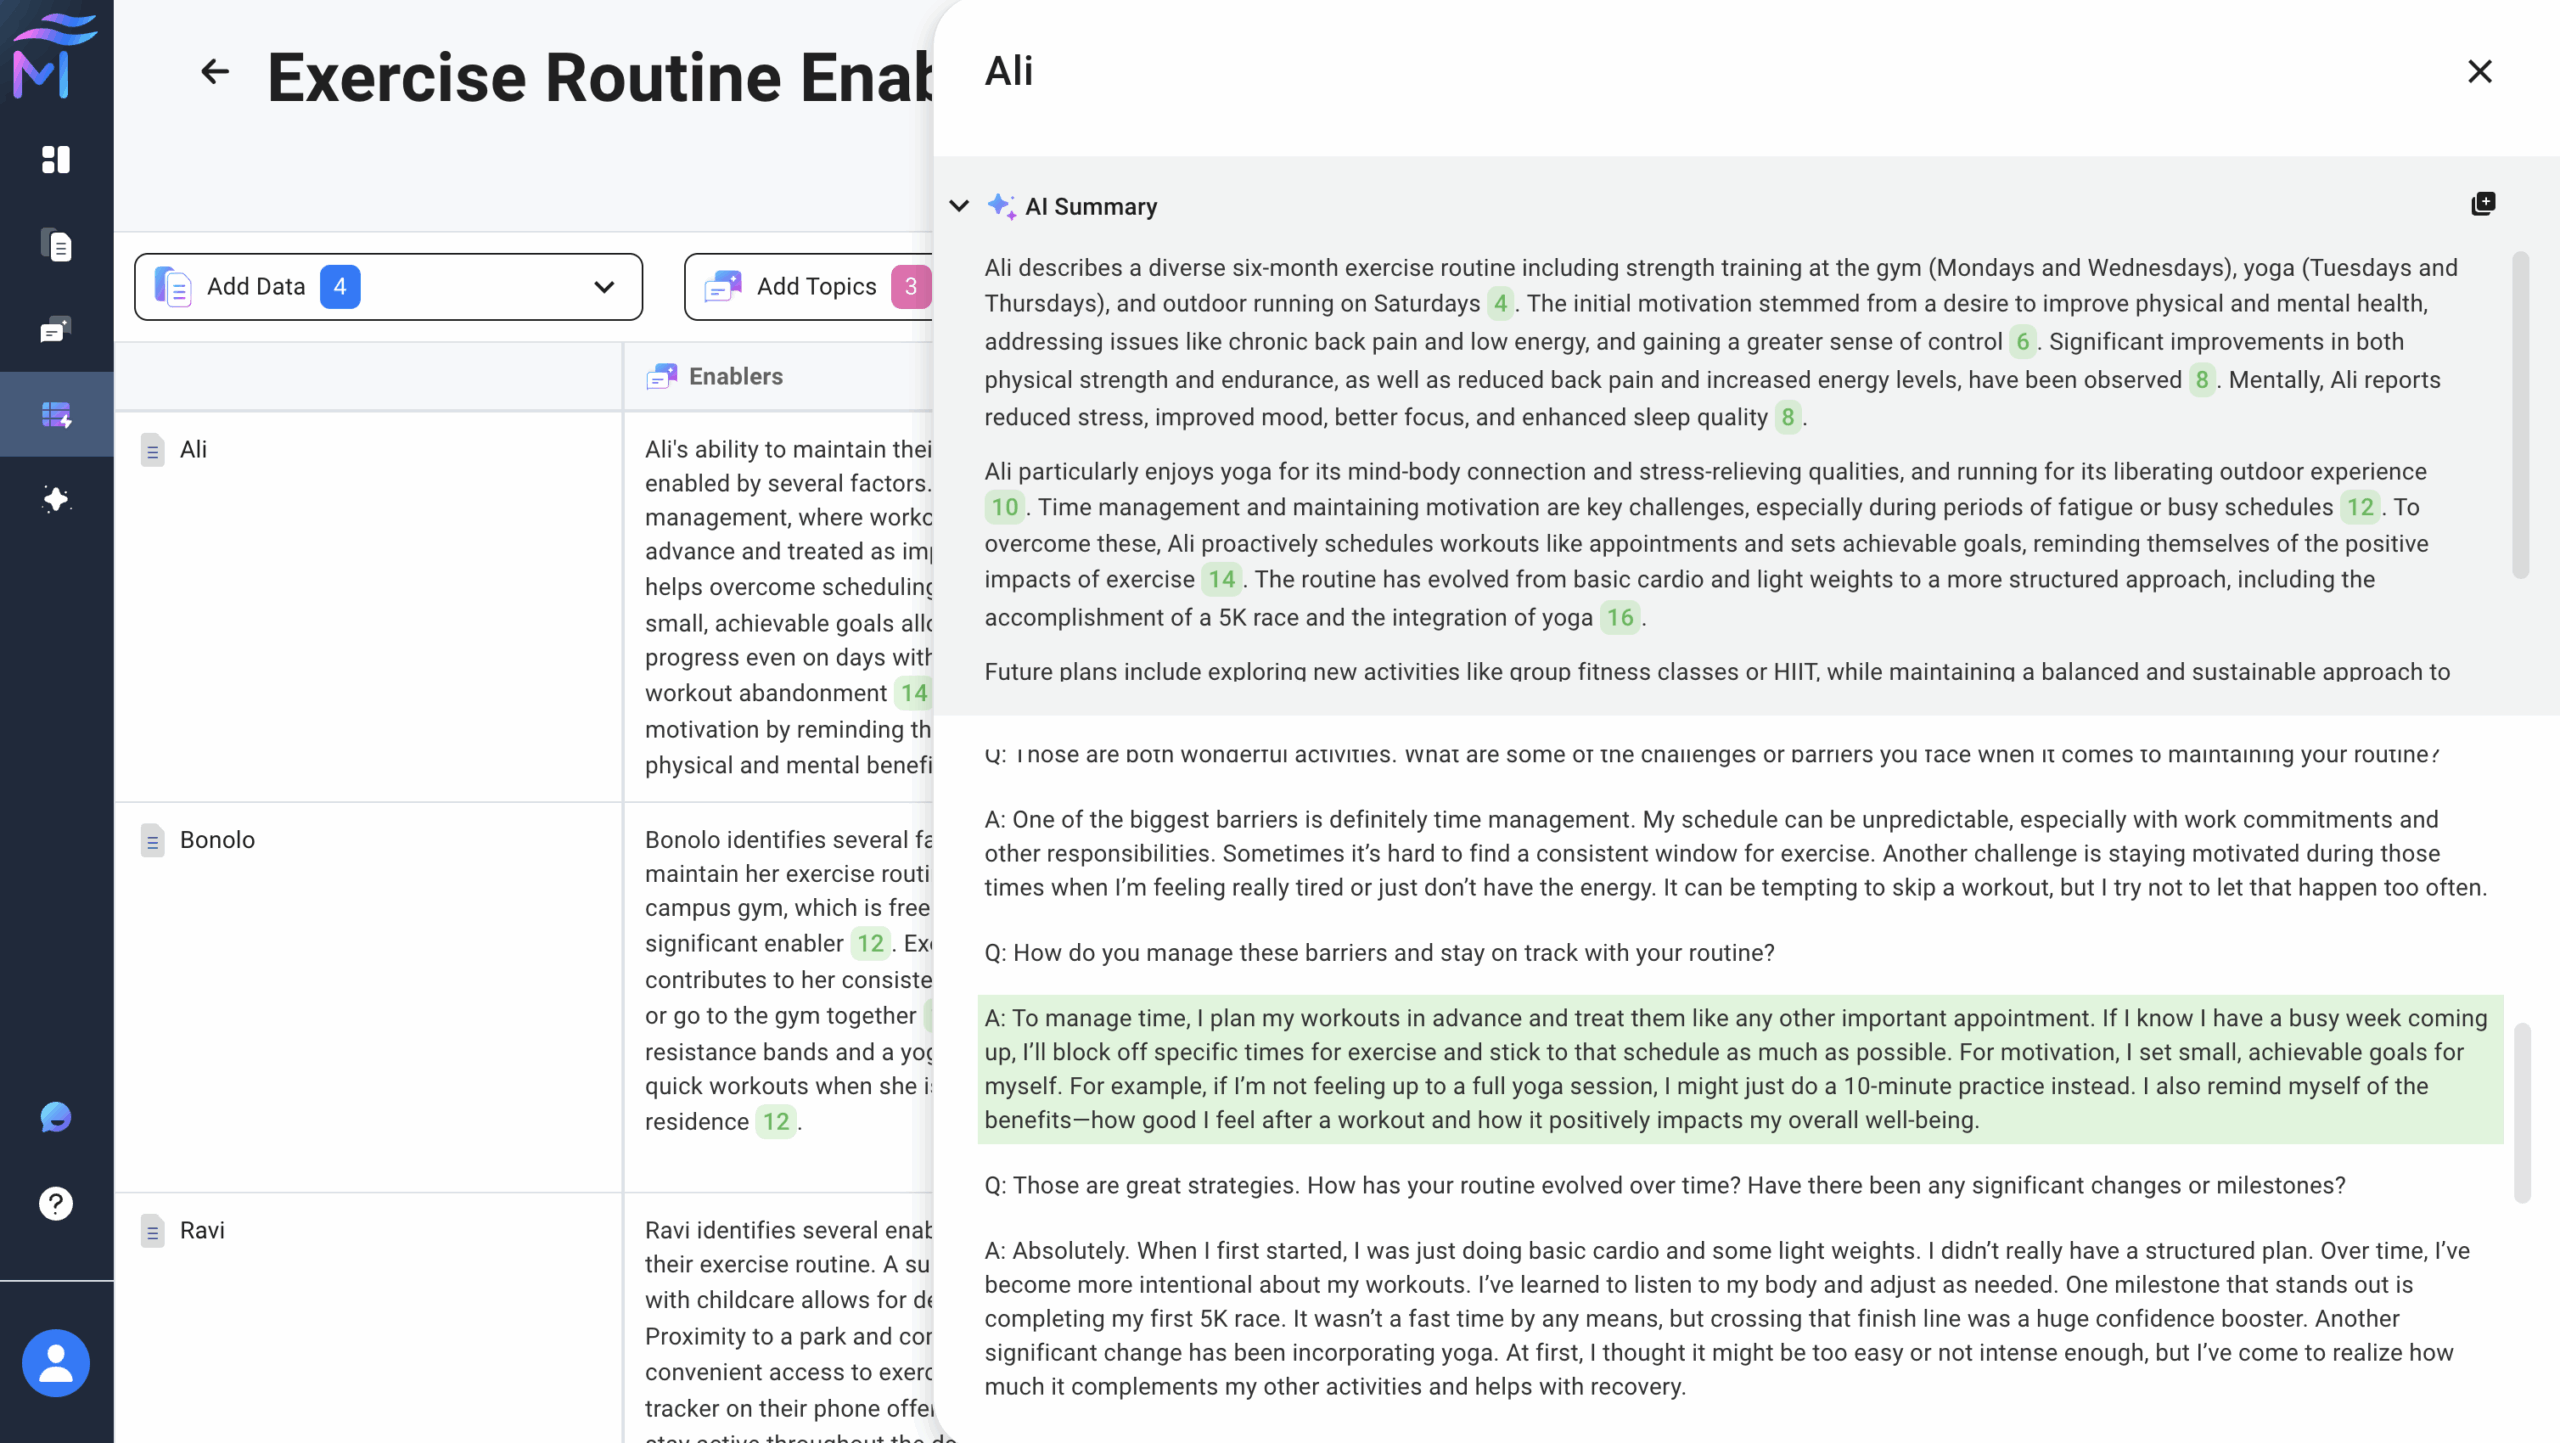
- Click on a reference in the cell to open the “Document View” panel.
- The “Document View” panel slides open on the right, displaying:
- AI Summary (top): Provides an overview of the document. Click any reference to see where that information comes from.
- Original Document (below): Automatically scrolls and highlights the matching text in green when you click a reference in the summary.
- You can use the Copy to Clipboard icon to copy the entire summary.
- You can use the
- To close the “Document View,” click the Close icon at the top of the panel.
Searching within Summary Tables
To search within a summary table, click the ![]() Magnifying glass icon in the upper right corner to open the search bar.
Magnifying glass icon in the upper right corner to open the search bar.
Exporting a Summary Table
To export a summary table in Excel format, click the ![]() Export button.
Export button.
Exiting a Summary Table
To return to the ![]() Summary Tables dashboard, click the
Summary Tables dashboard, click the ![]() back icon located at the top left corner of the page.
back icon located at the top left corner of the page.
⚙️ Managing Summary Tables
Renaming Summary Tables
To rename a summary table in the ![]() Summary Tables dashboard:
Summary Tables dashboard:
- Click the Edit icon next to the table’s name that you’d like to edit.
- In the window that pops up, edit the name as desired.
- To apply your edits, click Save.
- Alternatively, to discard your edits, click Cancel or anywhere outside the field.
You can also rename an open table. To do so:
- Click the table name at the top to start editing.
- Type the new name.
- Click Done to save.
- Click Delete to discard changes.
- To cancel, click outside the editing field.
For an overview of the MAXQDA Tailwind interface, please visit our “Getting Started” page, where we cover the basics of navigating the web app.
Sorting Summary Tables
You can sort your summary tables by one column at a time to quickly find what you need:
- Hover over a column header to show the sort arrow.
- Click the header to sort:
- Text columns sort alphabetically.
- Number columns sort in ascending or descending order.
- Click the arrow again to switch the sort direction.
Checking Table Content Counts
The ![]() Summary Tables dashboard lists each table you created, along with the number of files and topics included.
Summary Tables dashboard lists each table you created, along with the number of files and topics included.
Deleting Summary Tables
To delete a summary table:
- Hover over the table you’d like to delete to reveal the ⋯ More Options icon and click it.
- Click Delete.

Important:
Please be aware that deleting a summary table cannot be undone, and tables cannot be restored once they have been deleted.
Searching for a Summary Table
You can use the search bar at the top of the ![]() Summary Tables dashboard to quickly find the table you’re looking for.
Summary Tables dashboard to quickly find the table you’re looking for.
What to Expect from Tailwind’s AI Output: Variation and Safety
- Nuances in topic document summaries across projects with identical data
When recreating a project from scratch with identical data, topic names, and descriptions, you might observe slight variations in the summaries generated within a Summary Table cell. Although the core content of these summaries will be largely similar, the specific wording may vary. - Consistency within projects
Conversely, if you create two Summary Tables within the same project using the same files and topics, the summaries presented in the cells of both tables will be identical. - For those interested in generative AI
MAXQDA Tailwind utilizes large language models (LLMs) set to a low temperature of 0.1 (at least in the Beta phase). This setting aims to achieve a balance between consistent, high-quality output and subtle variations that can enhance diversity, reflecting the complexities of qualitative data analysis. - Responsible AI
Tailwind is committed to the responsible use of AI. Therefore, if the analyzed data includes content flagged as harmful, the generative AI model may be unable to generate document summaries.