Table overviews can easily be filtered. For example, in the Data Editor you can display only the rows with documents containing more than 20 codes or whose names begin with “B”:
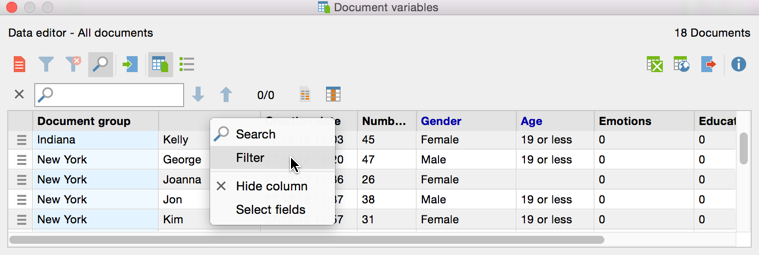
1. Right-click on the heading of the column you wish to filter, and select the Filter option.
Set filter by column
2. Set the desired filter options in the window that appears.
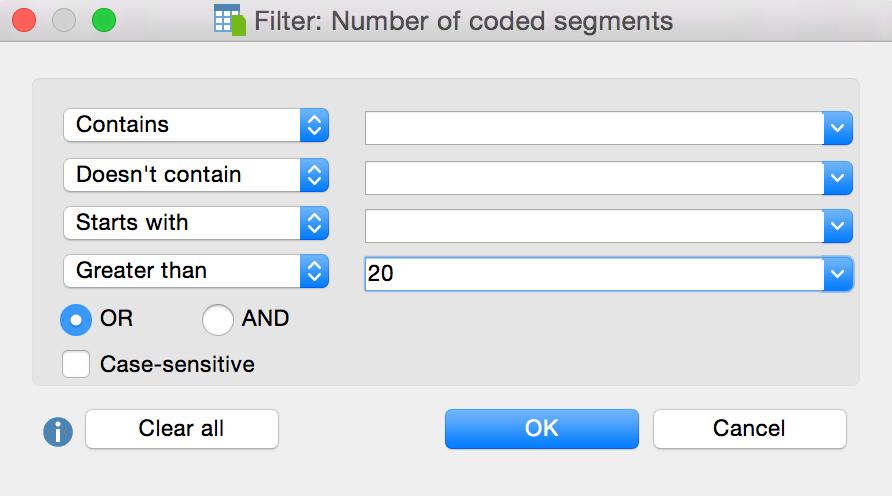
Filter window
In all four input fields, you can define criteria to filter. The following criteria are available:
• Contains
• Doesn’t contain
• Starts with
• Greater than or Lesser than (applies to both numbers and the alphabet)
• Earlier than and Later than (available only in columns containing a date)
OR/AND: Here you can select the manner in which the four input fields are combined. With OR, the rows in which at least one of the criteria applies are listed. With AND, the rows in which all of the criteria apply are listed.
Case sensitive – When this option is selected, you can differentiate based on whether the text in the text column appears in upper or lowercase. In this case, if “interview” in lowercase appears in the filtered column, “Interview” beginning with an uppercase letter would not be taken into account.
After clicking OK, MAXQDA filters the table overview according to the defined criteria. At the top right MAXQDA indicates how many of the originally existing rows are currently displayed.
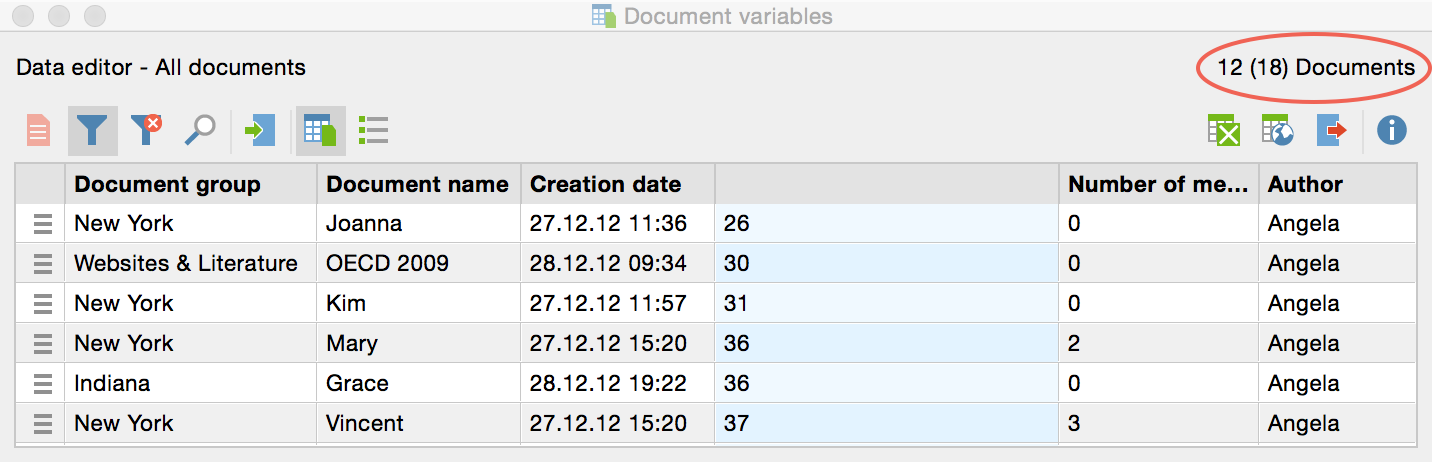
Filtered table overview
If you set a filter for multiple columns, they are combined with the AND function.
You can switch a filter for a table overview on or off at any
time using the Filter ![]() symbol, to toggle the view between all rows and
filtered rows.
symbol, to toggle the view between all rows and
filtered rows.
If you wish to delete all defined filters in an overview,
click on the Reset all filters ![]() symbol.
symbol.
Note: Each time an overview is
reopened, filters in table overviews will automatically be set to “off”. The
filter settings are saved individually for each overview in the project, so if
you have defined a filter and reopen the project at a later time, you can turn
on the filter by simply clicking the Filter ![]() symbol.
symbol.