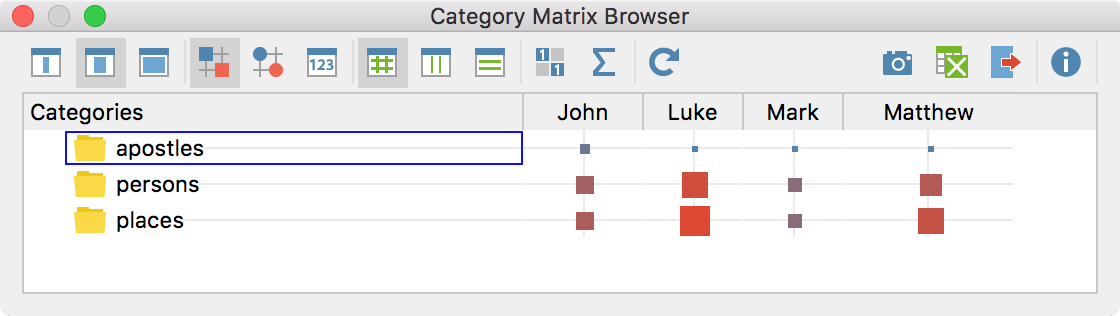
The Category Matrix Browser graphically displays the frequencies of the dictionary categories per unit of analysis. The categories of the dictionary form the rows while the evaluated texts form the columns:
The Category Matrix Browser
Call up the function via the menu MAXDictio > Category Matrix Browser. The following dialog window will appear, in which you can set whether the documents, document groups or document sets will be displayed in the columns:
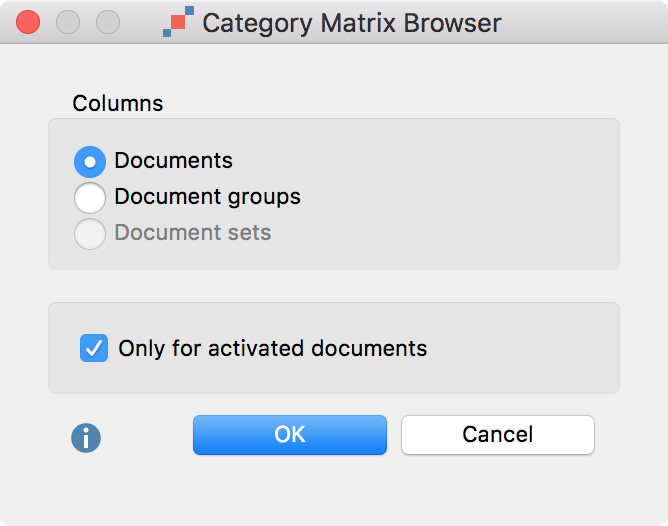
Setting options for the Category Matrix Browser
If you select the option Only for activated documents, only the documents activated in the “Document System” will be included in the display. Document groups and document sets without activated documents will not be displayed.
The nodes of the Category Matrix Browser contain the results of the count of the category frequencies. The larger a square, the more occurrences of the search terms of the respective dictionary category were found in the analyzed document, document group or document set.
Tip: The display is interactive. Double-click a node to display the search hits in the original text.
Customize the view using the symbols on the left:
![]()
![]()
![]() Names, columns: none, short, full – Sets the column
widths
Names, columns: none, short, full – Sets the column
widths
![]() Calculation of symbol size refers to all cells
Calculation of symbol size refers to all cells
![]() Calculation of symbol size refers to columns
Calculation of symbol size refers to columns
![]() Calculation of symbol size refers to rows
Calculation of symbol size refers to rows
![]() Display nodes as squares
Display nodes as squares
![]() Display nodes as circles
Display nodes as circles
![]() Display nodes as values
Display nodes as values
![]() Binarize view – Regardless of how many hits per cell are
present, it is always indicated whether at least one hit is present or not. The
symbol size is standardized.
Binarize view – Regardless of how many hits per cell are
present, it is always indicated whether at least one hit is present or not. The
symbol size is standardized.
![]() Sum – Hides or shows a sum column and a sum row
Sum – Hides or shows a sum column and a sum row
Using the icons on the right, the view can be exported as an image or a table:
![]() Copy current display as an image to clipboard –The
currently displayed matrix will be copied to the clipboard and can be inserted
with Ctrl + V (Win) or Cmd + V (Mac) into Word, PowerPoint and other
programs.
Copy current display as an image to clipboard –The
currently displayed matrix will be copied to the clipboard and can be inserted
with Ctrl + V (Win) or Cmd + V (Mac) into Word, PowerPoint and other
programs.
![]() Open as Excel Table – Displays the matrix with
frequencies in Excel.
Open as Excel Table – Displays the matrix with
frequencies in Excel.
![]() Export – Exports the displayed matrix as values in Excel,
HTML or TXT format. It is also possible to export the matrix as a graphic file
in PNG and SVG format.
Export – Exports the displayed matrix as values in Excel,
HTML or TXT format. It is also possible to export the matrix as a graphic file
in PNG and SVG format.
Hint: When exporting as a table, rows and columns are reversed in order to allow easy evaluation using statistics programs. The rows will therefore contain the units of analysis (cases) and the columns will contain the categories (comparable to variables).