I will try to show you what I do, and why 'counting frequencies' is not as easy as it seems when you have a s ystem with sub-sub-subcodes.
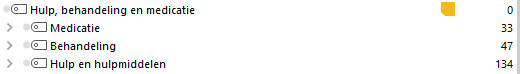
First: one or our main categories is called 'Support, treatment and medication'. On parent level we aggregate this, because it is all about help/care/treatment/support.
See here:
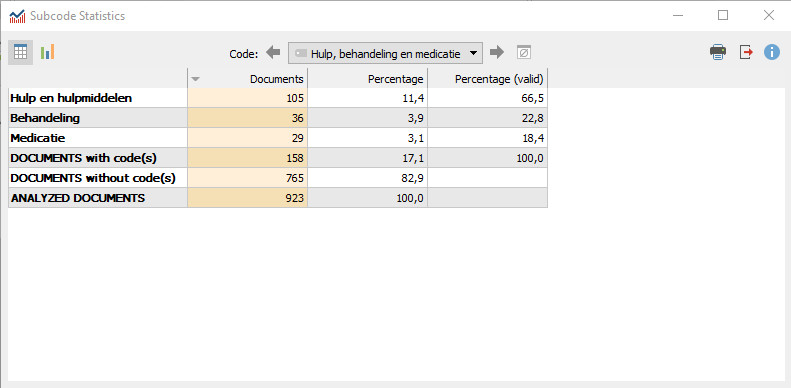 table 1
From 923 documents in total, there are 158 documents (=cases) about 'Support, treatment and medication'.
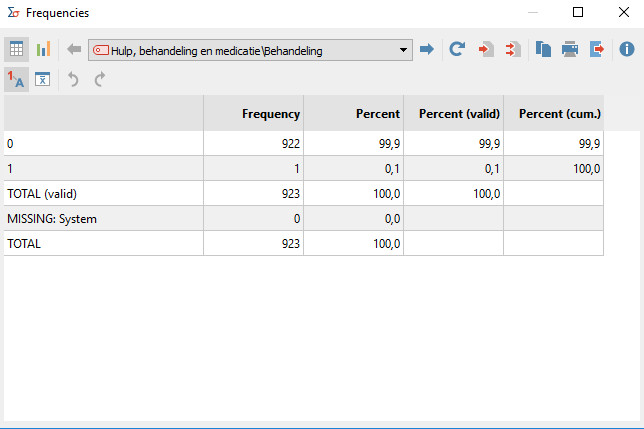
Looking more in detail, we see that 36 documents are about 'treatment' (behandeling).
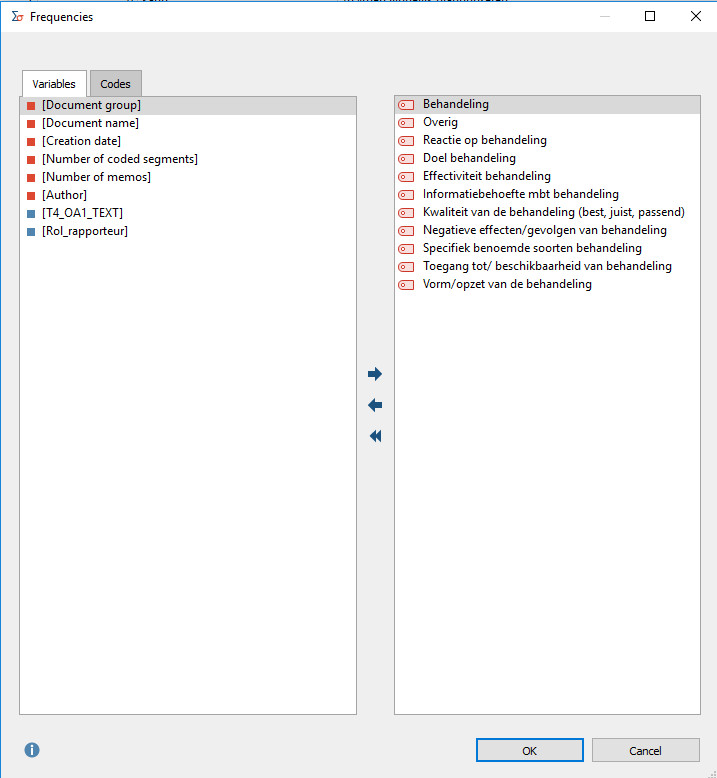
Second: I take a closer look into the part about 'treatment'.
I use the function 'subcode statistics'.
Result:
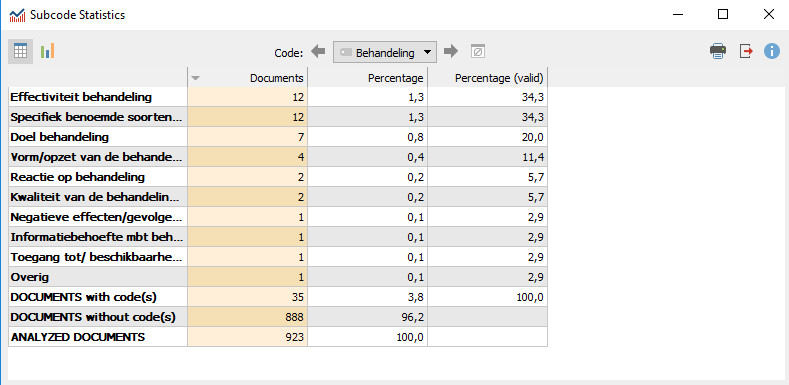 table 2
We see for instance that 'effectiviteit van behandeling' is most often mentioned, while other aspects of treatment are mentioned less.
This is a usefull frequency table.
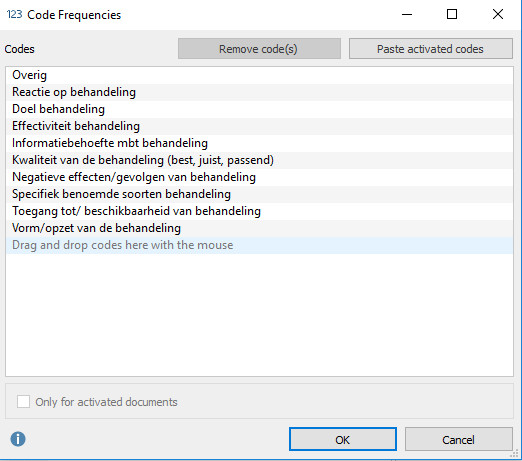
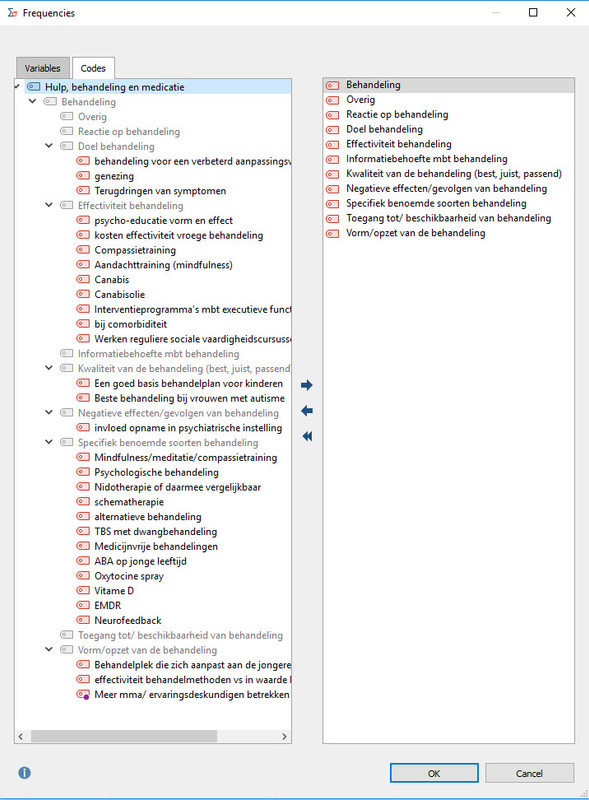
Third: using the function 'Code frequencies' for the subcode 'Treatment' (remember this is a subcode in the category support and treatment and medication)
This results in a long list:
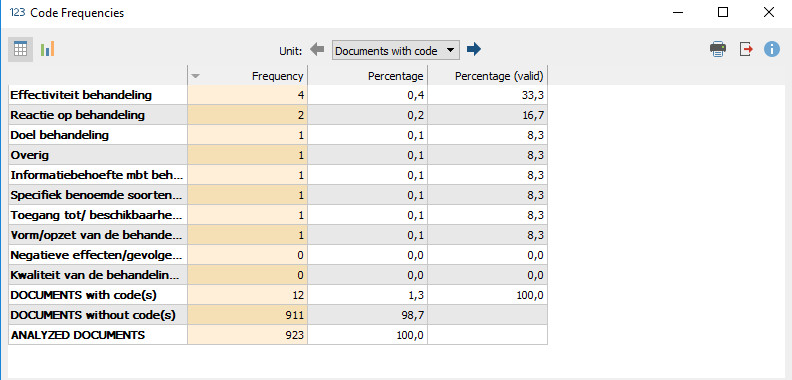
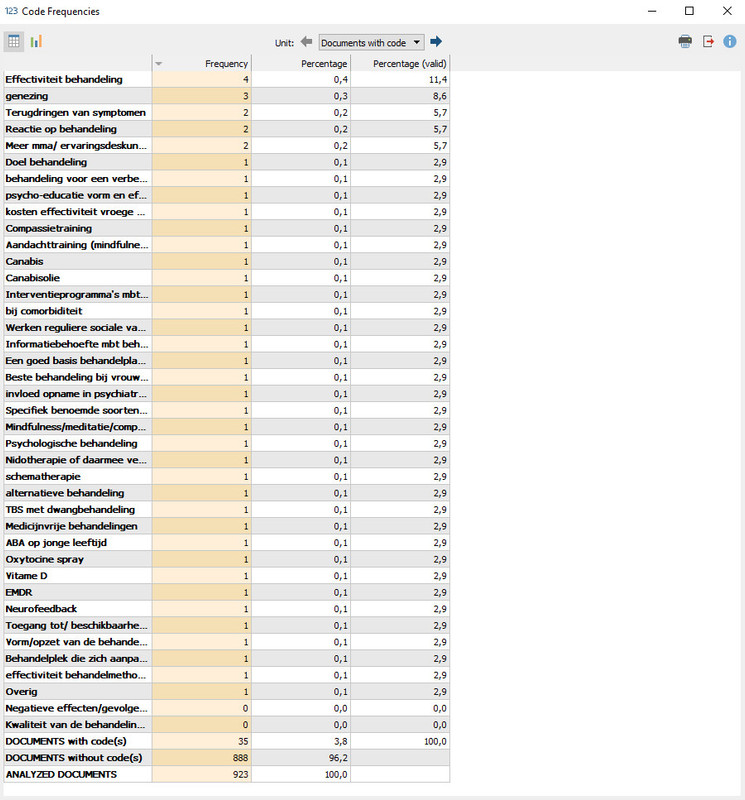 table 3
Conclusion for me: not useful
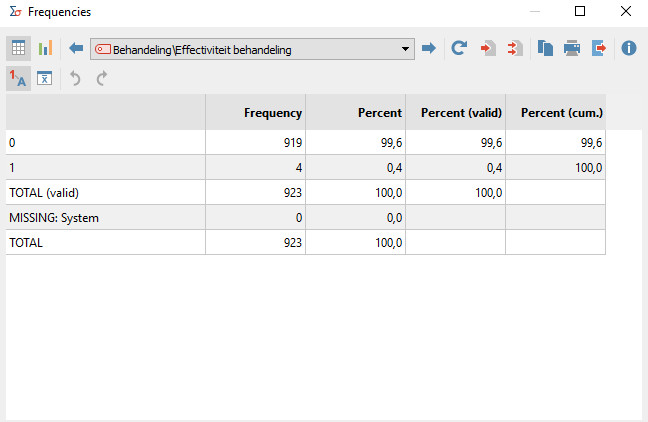
It does not automatically collaps, aggregate and sum sub-sub-level codes. So, for instance, I can no longer see how often 'effectiviteit van behandeling' is mentioned.
From the previous results I know that this is in 12 documents.
Based on this result, it says only 4 documents, which is not true, but sublevel codes are not summed, but split.
[continue in next message]