MAXQDA

frequency tabels

09.07.2018, 19:21

I tried to create frequency tabels, as explained here: https://www.maxqda.com/help-max18-stats/frequency-tables

So, I followed the step by step instructions. But seemingly I do something wrong. So, what do I do wrong?

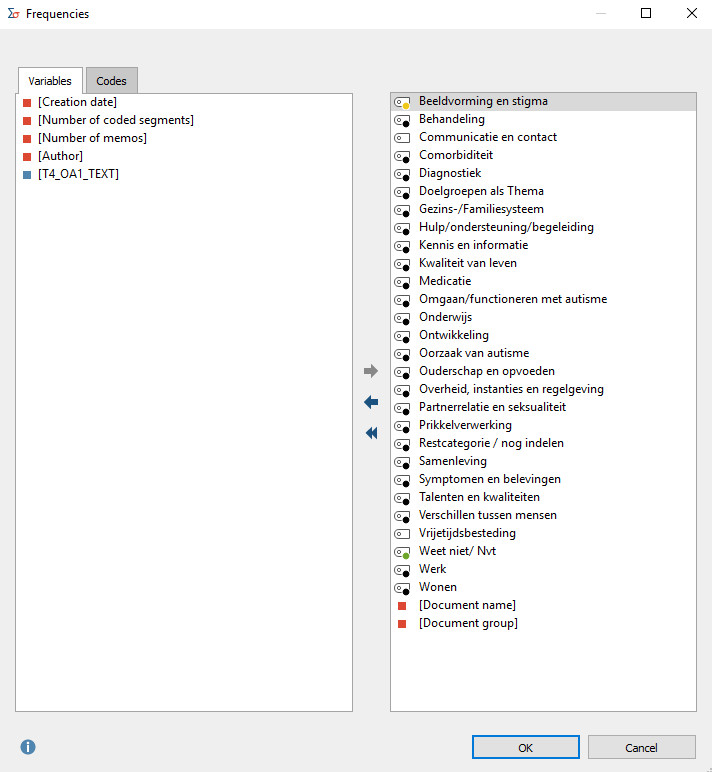
Step 1: In the window that appears, select the variables for which you would like to create frequency tables, and Switch to the “Codes” tab and select the codes for which you would like to create frequency tables.
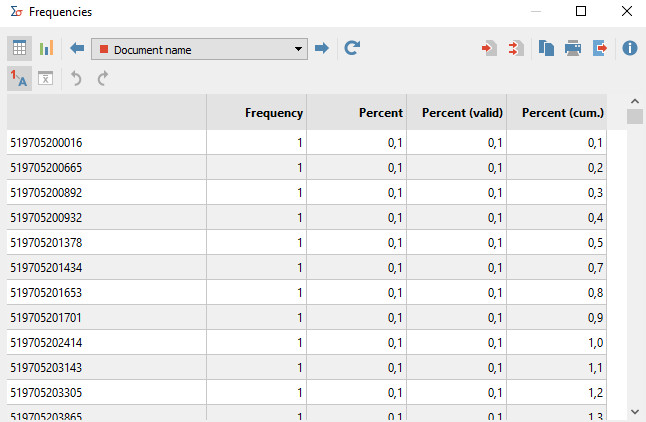
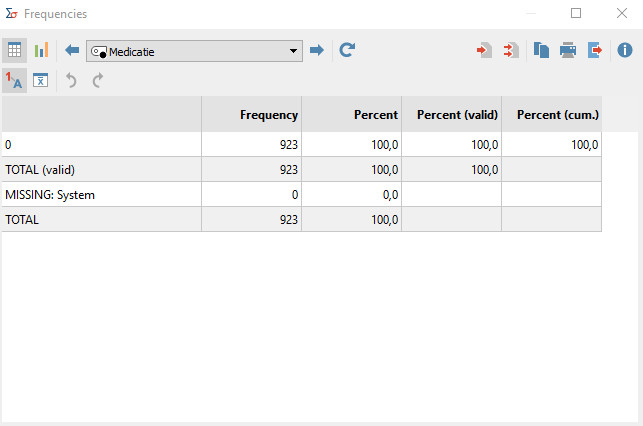
Result:

Version: MAXQDA 2018
System: Windows 10
Loekarin
 
Posts: 45
Joined: 25.06.2018, 12:39

Re: frequency tabels

09.07.2018, 19:32

I selected all parent codes.

Then: "When you click OK, MAXQDA Stats creates a frequency table and displays it in a results view."

But then I do not get the same kind of results as shown online.
According to the manual, the frequency table displays how many times the individual variables occur.

But my frequency tabel shows this:


As if each document has only 1 variable assigned. But instead I have assigned multiple codes to a document.

If I select a code as variable, such as the code 'Medication' , the frequency tabel looks like this:

Loekarin
 
Posts: 45
Joined: 25.06.2018, 12:39

Re: frequency tabels

09.07.2018, 19:34

So, my questions are:

-How should I interpret the results (output) of my frequency tables? Now I don't know what they mean.

-I followed the step-by-step instructions in the manual at https://www.maxqda.com/help-max18-stats/frequency-tables

Why don't I get the same kind of frequency table as is shown on this page?
Loekarin
 
Posts: 45
Joined: 25.06.2018, 12:39

Re: frequency tabels

10.07.2018, 13:29

Hi Karin,

thanks for the question and posting those screenshots! That makes it much easier. I'll go through your questions one by one:

How should I interpret the results (output) of my frequency tables? Now I don't know what they mean.

The frequency feature will put every value of the selected variable/code in a row, and display in the cells how frequently that value appeared. So the first screenshot tells us with it's first row that there is one document where the variable value is 51970520016 [the name of the document]. And then it goes on for every other document.

Same with the codes: The code "Medicatie" has 923 times the value "0" (it hasn't been assigned to any of the 923 documents).

Do you already know the "Code-Matrix-Browser"? If you're interested in the occurence of codes across documents/document groups, that's the tool to go with. You can check out our video tutorial here (still for MAXQDA 12, but it works mostly the same):

https://www.youtube.com/watch?v=IlkcSu-VfZY

Or you read about it here:

https://www.maxqda.com/help-max18/visual-tools/code-matrix-browser-visualizing-codes-per-document

Just as an fiy, there is also a new video tutorial that gives an overview over all the visual tools; you can check it out here:

https://www.maxqda.com/learn-maxqda/maxqda-2018-video-tutorials#&id=k02Zlr5hbhk

I hope this helps! If not, or in case of any other questions, please don't hesitate to contact us again.

Best regards on behalf of the MAXQDA support team,

Andreas
Andreas V.
 

Re: frequency tabels

10.07.2018, 16:42

"Same with the codes: The code "Medicatie" has 923 times the value "0" (it hasn't been assigned to any of the 923 documents)."

Yes, but that is strange, at least on aggregate level. Because we definitely assigned subcodes of 'medicatie' to documents.
As you can see here, after collapsing subcodes to the parent code, the code 'medication' has been assigned 25 times to segments.

Loekarin
 
Posts: 45
Joined: 25.06.2018, 12:39

Re: frequency tabels

10.07.2018, 16:51

and question 2:
"Do you already know the "Code-Matrix-Browser"? If you're interested in the occurence of codes across documents/document groups, that's the tool to go with"

Yes, you told me so in another topic.
Could you please explain to me in what instances you DO use the 'frequency table'?

Based on the frequency table I should be able to create a frequency chart:


So, again, I think it should be possible for me, with my data, to create frequency tables and frequency charts. Currently, I do not understand why this would not be possible.
Loekarin
 
Posts: 45
Joined: 25.06.2018, 12:39

Re: frequency tabels

11.07.2018, 16:28

Hm yes, I can see how a missing "aggregate frequencies"-option can be confusing when you are expecting all the frequencies-features to be part of Stats. I'll add it to our wishlist. I think it's probably not in there because you can do this with another feature which is part of the standard version (and much older); it's called "Subcode Statistics" (formerly known as "Statistics for Subcodes" I believe), and can be found in the "Codes"-tab. It will give you the frequency for the subcodes of a selected top level code (whose aggregated frequencies will then be the "Sum"-value of course). You can read more about it here:

https://www.maxqda.com/help-max18/statistics-and-graphics-functions/frequency-tables-charts-subcodes

You can also generate a frequency table/chart for the number of coded segments for your (activated) documents. You'll find this option under Reports > Overview of Codes; on the top, the second button from the right will lead you to the table/chart.

I hope one of these features is what you are looking for?
Andreas V.
 

Return to MAXQDA in Research

Who is online

Users browsing this forum: No registered users and 11 guests

We use cookies to improve your experience on our website. By clicking OK or by continuing to browse the website, we’ll assume that you are happy with their use. Click here to review our Cookie Policy. OK