After starting the calculation by clicking OK a crosstab will be computed for each combination of rows and columns variables. The figure above shows a selection for which four crosstabs will be created. A results table then appears that allows you to switch between the single crosstabs by using the blue arrows and the drop down menu at the top of the window.
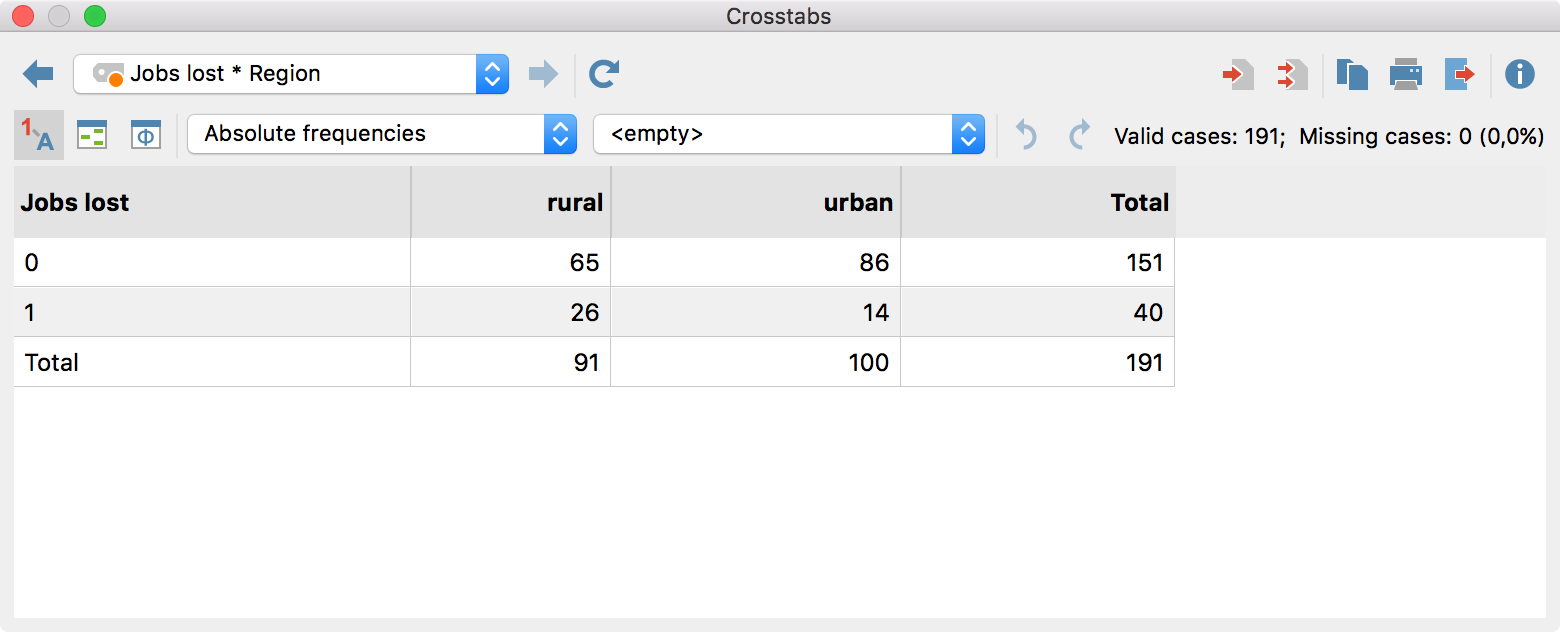
Results table for the function “crosstabs”
The number of valid and missing values for the displayed variable combination is shown in the upper right corner.
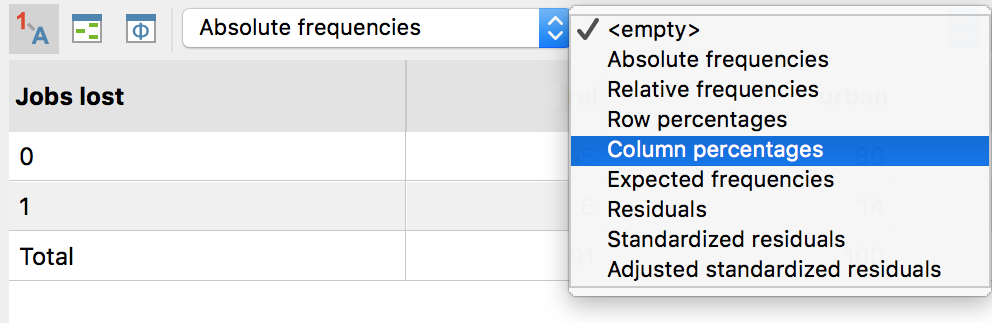
If you start the function “crosstabs” the numbers in the cells display the absolute frequencies, thus the number of cases for each combination of variable values. You can switch the display for the cells to the following values:
● Relative frequencies – percentage based on all valid values
● Row percentage – percentage based on the sum of a row
● Column percentages – percentage based on the sum of a column
● Expected frequencies – expected frequencies in case of independence of both variables
● Residuals – differences between observed absolute frequencies and the expected. In case of positive residuals more cases occurred than would be expected considering the marginal distributions.
Standardized residuals – in order to gain a better comparability the residuals are divided by the root of the expected frequencies. The standardized residuals’ magnitude corresponds to the root of the particular cell’s Chi-square.
Corrected standardized residuals – the standardized residuals are adjusted on the basis of the marginal frequencies.
The cells of the crosstab display either one or two of the presented values. Use the drop down menu on the top of the chart to select the values you want to display.
Setting the content for the cells
You can use standardized residuals for the exploratory interpretation of the table. This is possible because based on the assumption of the independency of the two tabulated variables the standardized residuals are asymptotically normally distributed. Accordingly, a standardized residual greater than 2 or less than -2 indicates an unexpected high or low number of observations in the cell. Values that exceed the magnitude of 2.6 are even less expected.
Click on the icon Highlight cells with
high standardized residuals ![]() . Now
MAXQDA Stats highlights all cells with a standardized residual greater than 2 in
blue and all cells with values smaller than 2 in red. If there are values whose
magnitude is greater than 2.6 the cells are additionally displayed in a darker
colour.
. Now
MAXQDA Stats highlights all cells with a standardized residual greater than 2 in
blue and all cells with values smaller than 2 in red. If there are values whose
magnitude is greater than 2.6 the cells are additionally displayed in a darker
colour.
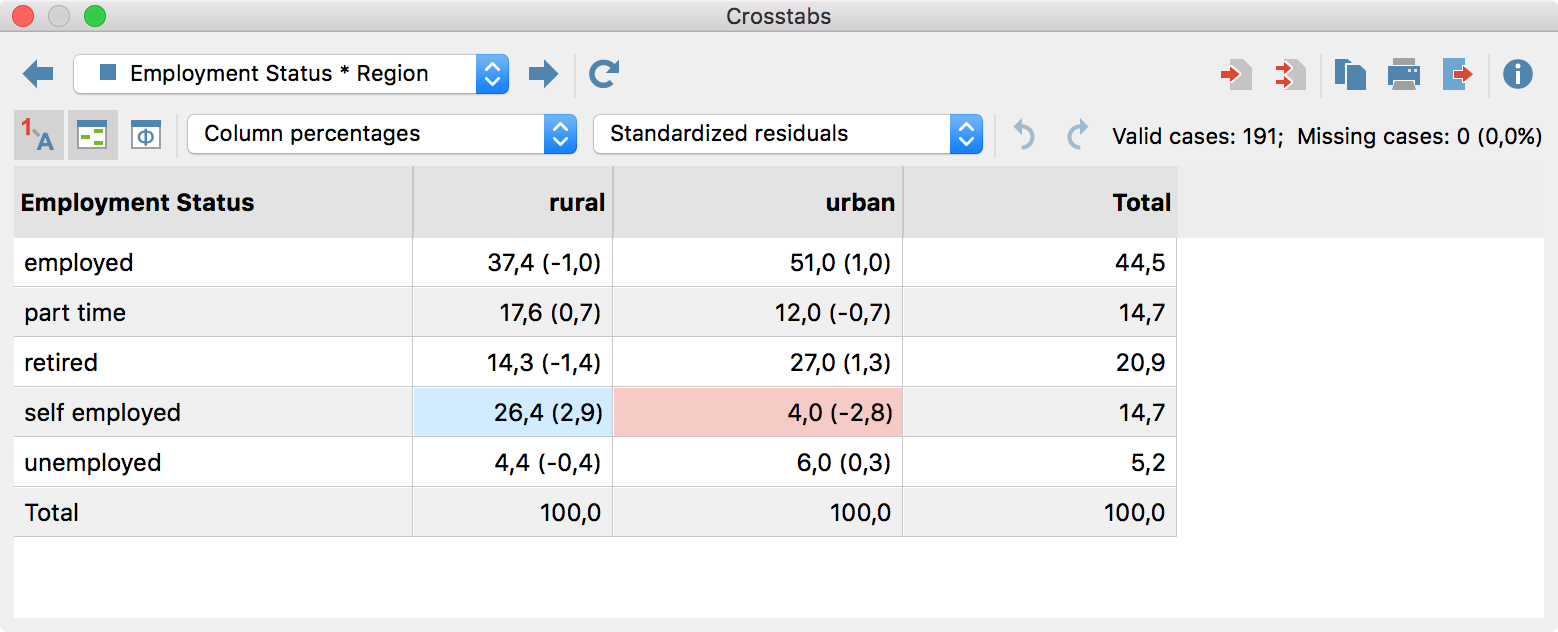
Crosstab with highlighted cells for easier interpretations
In the upper section of the results window two toolbars are located, which contain the following important functions:
![]() Previous/Next – using the blue arrow or the selection
list, switch between the created crosstabs table.
Previous/Next – using the blue arrow or the selection
list, switch between the created crosstabs table.
![]() Refresh – Recalls the dialog window for creation of
crosstabs.
Refresh – Recalls the dialog window for creation of
crosstabs.
![]() Insert into output viewer – inserts the currently
displayed table in the Output Viewer.
Insert into output viewer – inserts the currently
displayed table in the Output Viewer.
![]() Insert all into output viewer – inserts all created tables
in the Output Viewer.
Insert all into output viewer – inserts all created tables
in the Output Viewer.
![]() Copy to clipboard – copies the current table or
the highlighted area in the table in the clipboard, for example for insertion
into Word.
Copy to clipboard – copies the current table or
the highlighted area in the table in the clipboard, for example for insertion
into Word.
![]() Print
– prints the currently displayed table.
Print
– prints the currently displayed table.
![]() Export
– exports the currently displayed table in Excel format, website (HTML)
format or RTF format for Word and other word processing programs; exports the
currently displayed chart in PNG, SVG or EMF (only Windows) format.
Export
– exports the currently displayed table in Excel format, website (HTML)
format or RTF format for Word and other word processing programs; exports the
currently displayed chart in PNG, SVG or EMF (only Windows) format.
![]() Show value labels – this option is selected by
default and causes the defined value label of a variable to be displayed in the
place of the value of the variable.
Show value labels – this option is selected by
default and causes the defined value label of a variable to be displayed in the
place of the value of the variable.
![]() Highlight cells with high standardized residuals – switch on this option to
highlight cells, whose magnitudes of standardized residuals are greater than 2
for easy interpretation of the results.
Highlight cells with high standardized residuals – switch on this option to
highlight cells, whose magnitudes of standardized residuals are greater than 2
for easy interpretation of the results.
![]() Association measures – opens a window with
association measures for the two variables displayed in the actual
crosstab.
Association measures – opens a window with
association measures for the two variables displayed in the actual
crosstab.
![]() Undo changes – step-by-step resetting of
changes to a table (deletion of rows, merging and moving of rows).
Undo changes – step-by-step resetting of
changes to a table (deletion of rows, merging and moving of rows).
![]() Redo
– step-by-step restoring of changes to a table.
Redo
– step-by-step restoring of changes to a table.
Tables can be sorted by clicking a column header, in ascending order with the first click and descending order with the second. Clicking again will restore the original order.
Tip: You can also move the rows of the results table. Click a row, then drag and drop with the mouse to the desired location. This function is also available for multiple highlighted rows. Lines containing totals or missing values cannot be moved.
Column widths can be adjusted with the mouse, and their positions can be changed by clicking the column header then dragging them to the desired location with the mouse.
The results table is interactive and one or more rows can be removed, for example to restrict the evaluation to selected variables. Right-click a row and select Delete. You can also select multiple rows to delete by holding down the Ctrl/cmd key.
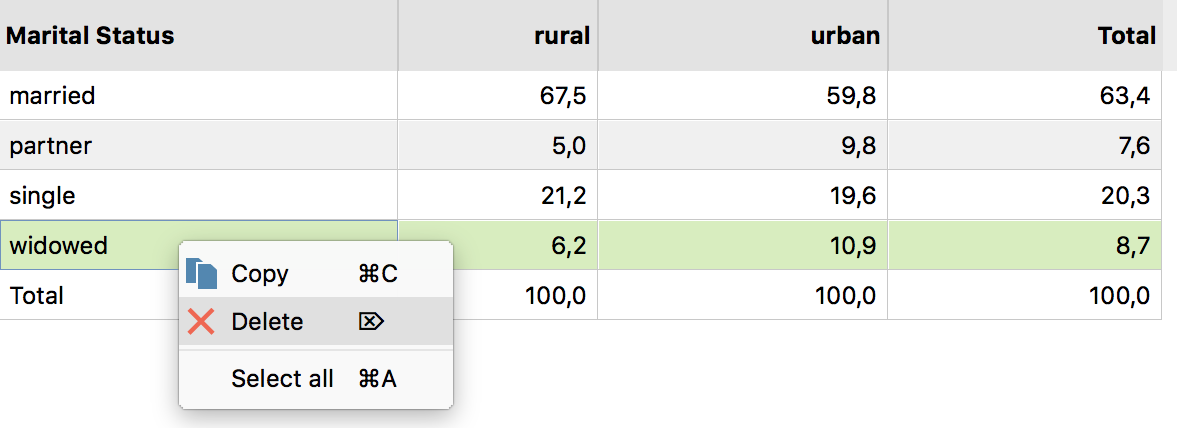
Delete a row from the results table using the context menu
To delete a column from the results table, right click on its heading and select Delete.
The table will be automatically updated after deletion of rows or columns.
The interactive results table also allows you to merge multiple values:
1. Highlight at least two rows by holding down the Ctrl/cmd key as you click on the desired rows with the mouse.
2. Right-click the selection and select Merge values.
In the following example, the two values “married” and “partner” are merged:
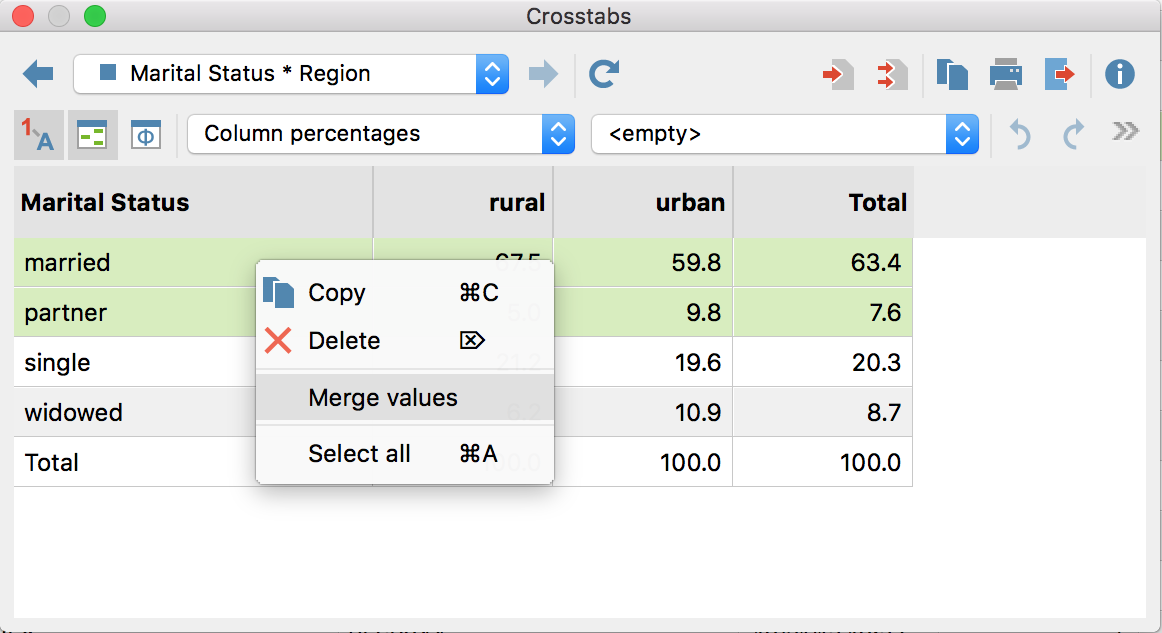
Merge multiple values using the context menu
Columns can be merged, too:
1. Right-click on a column heading and select Merge values.
2. A popup menu appears containing all other columns of the crosstab. Click on one of the displayed columns to merge it with the right-clicked column.
The table will be automatically updated after merging columns or rows.
If MAXQDA Stats is launched with the data from a MAXQDA project, the frequency in a cell corresponds to a compilation of documents in which the combination of variable values occurs. This compilation of documents can be saved as a document set in MAXQDA: Right-click on a row and select Save as document set.
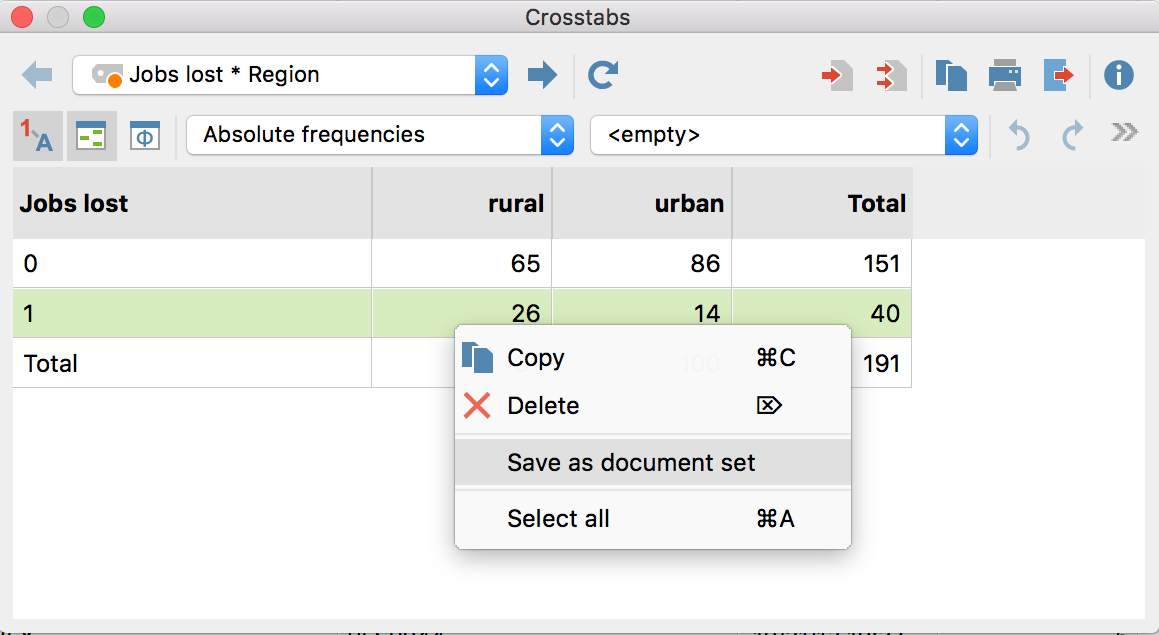
Store documents that are attached to a combination of variable values as a document set in MAXQDA
Initially, MAXQDA stores such sets in the background. When you exit Stats, all document sets created during the analysis will be displayed, so you can select which document sets you wish to transfer to the MAXQDA project.
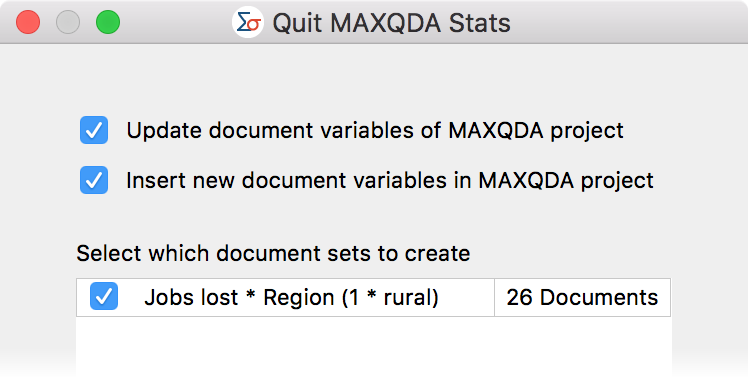
Select document sets upon exiting MAXQDA Stats