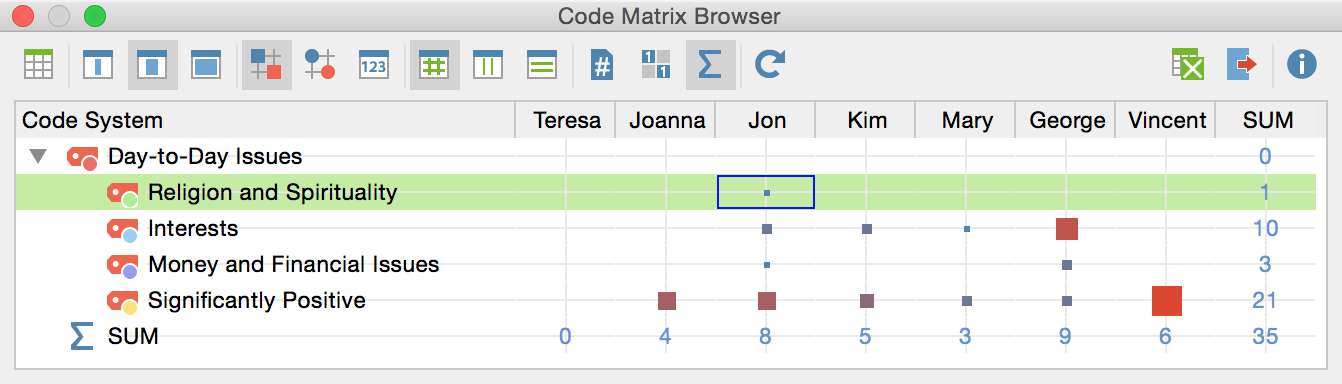
The Code Matrix Browser (CMB) offers you a new way of visualizing which codes have been assigned to which documents. The matrix provides an overview of how many document segments from each document have been assigned a specific code, and this for each existing code.
The Code Matrix Browser is constructed as follows: Documents are listed in the columns while codes are listed in the rows. The symbols at the conjunction points represent the number of coded segments that are coded with a particular code. The larger the symbol, the more coded segments are assigned to the code in question.
The Code Matrix Browser
The Code Matrix Browser can be opened in the following ways:
•Selecting Code Matrix Browser from the Visual tools drop-down menu,
•using the keyboard shortcut Ctrl+Alt+M (Windows) or cmd+Alt+M (Mac)
•clicking on the CMB symbol in the “Visual tools” toolbar.
![]()
CMB symbol in the “Visual tools” toolbar
After opening the Code Matrix Browser an options window will appear, which allows you to change display options. Often, only the activated documents might be of interest, for example.
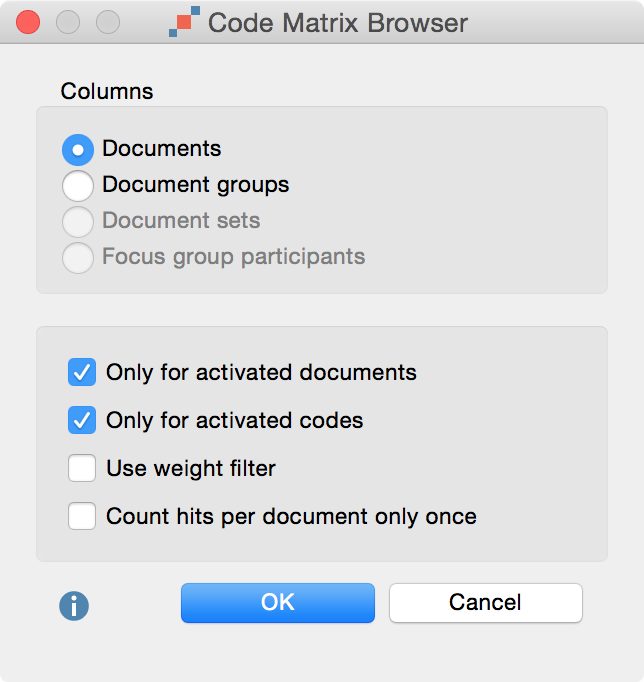
Code Matrix Browser options dialog window
First you have to decide whether the results should be grouped or not:
Documents – No grouping, every document has a column.
Document groups – The columns are made up of document groups. The coded segments of the documents in each group will be summed up.
Document sets – The columns are made up of document sets. The coded segments of the documents in each document set will be summed up.
Focus Group Participants – Focus group participants are displayed in the columns.
Further options allow you to restrict and adjust the display:
Only for activated documents – Only the activated documents will be displayed. (If there are no activated documents in a document group or document set, the CMB will be empty.)
Only for activated focus group participants – Only activated focus group participants will be displayed in the columns. This option is visible only when the corresponding option above is selected.
Only for activated codes – Only the activated codes will be displayed as rows.
Use weight filter – Only coded segments with a weight within the limits of the weight filter will be used.
Count hits per document only once – This option will be displayed only if a code occurs infrequently within a document. The unit of analysis is therefore not the individual segment, but rather the full document.
The first thing you will see at the top of the Code Matrix Browser window is the toolbar, which gives you access to the following functions:
![]() Quote Matrix – Displays coded segments as an Excel
file
Quote Matrix – Displays coded segments as an Excel
file
![]()
![]()
![]() Names, columns: none/short/full – Determines display of
document names in column headers.
Names, columns: none/short/full – Determines display of
document names in column headers.
![]() Calculation of symbol size refers to all coded
segments.
Calculation of symbol size refers to all coded
segments.
![]() Calculation of symbol size refers to the column.
Calculation of symbol size refers to the column.
![]() Calculation of symbol size refers to the row.
Calculation of symbol size refers to the row.
![]() Display nodes as squares.
Display nodes as squares.
![]() Display nodes as circles.
Display nodes as circles.
![]() Display nodes as values.
Display nodes as values.
![]() Count hits per document only once – The Code Matrix
Browser display will be based not on the number of coded segments but rather on
the full document, meaning it will display only whether the code occurs in the
document or not. For collapsed subcodes, the code frequency of the subcodes will
be aggregated.
Count hits per document only once – The Code Matrix
Browser display will be based not on the number of coded segments but rather on
the full document, meaning it will display only whether the code occurs in the
document or not. For collapsed subcodes, the code frequency of the subcodes will
be aggregated.
![]() Binarize view – Regardless of how many coded segments are
present in a cell, this function displays only whether a coded segment is
present or not; the symbol size is therefore unified. Even when a collapsed
subcode with multiple encodings is present, only one will be counted.
Binarize view – Regardless of how many coded segments are
present in a cell, this function displays only whether a coded segment is
present or not; the symbol size is therefore unified. Even when a collapsed
subcode with multiple encodings is present, only one will be counted.
![]() Sum – displays the sum of rows and columns.
Sum – displays the sum of rows and columns.
![]() Refresh – updates display via the Refresh function.
Refresh – updates display via the Refresh function.
![]() Open as Excel table – Displays the matrix with the code
frequencies of the Code Matrix Browser in Excel. The columns and rows are
reversed to allow an easier import into SPSS.
Open as Excel table – Displays the matrix with the code
frequencies of the Code Matrix Browser in Excel. The columns and rows are
reversed to allow an easier import into SPSS.
![]() Export – Exports the displayed matrix as values, meaning
the number of coded segments per code and per document, in Excel or HTML format.
The columns and rows are reversed to allow an easier import into SPSS. Export as
a graphic file (Vector or Bitmap) is also possible.
Export – Exports the displayed matrix as values, meaning
the number of coded segments per code and per document, in Excel or HTML format.
The columns and rows are reversed to allow an easier import into SPSS. Export as
a graphic file (Vector or Bitmap) is also possible.
The size and color of the clusters in the matrix show how many document segments in each document have been assigned each particular code and subcode. The larger the cluster, the greater the number of segments that were assigned this code or category in this document.
Tip: The sequence in which the documents are displayed is determined by their sequence in the Document System. If you wish to change the order of the documents, you must do so in the Document System.
When you move the mouse cursor over a cluster, a screen tip appears:
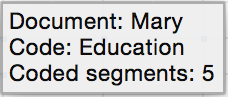
Tooltip in the Code Matrix Browser
The name of the document, the code or subcode, and the number of coded segments assigned to the code are shown in the box.
The document names in the column headers can be displayed in three ways:
1. ![]() without document
names,
without document
names,
2. ![]() with short document
names, or
with short document
names, or
3. ![]() with full document
names.
with full document
names.
The number of documents that can be displayed as columns in the matrix depends on this setting. In most cases, it is sufficient to use short document names, showing only the first few letters, which nevertheless is enough for you to recognize it. If in doubt about a document, you can take a look at the screen tip, where the full document name is displayed. If necessary, the width of the columns can be adjusted by clicking on a dragging the lines between column headers. For focus group participants, the names of the participants will be displayed in the columns in the place of the document names.
Tip: The columns can be easily moved with the mouse. In this way, you can easily compare the coded segments of two different documents or focus group participants.
The codes are displayed in the CMB in the same way as in the “Code System,” in a tree structure similar to that of Windows Explorer or Mac Finder. Subcodes can be collapsed in the usual way, by clicking the – symbol.
Tip: When the subcodes are collapsed, the number of coded segments is aggregated on the parent code level. If a parent code (that hasn’t been used in the document) has three subcodes with 10 coded segments each, when you collapse the subcodes, the parent code will show 30 coded segments.
MAXQDA determines the minimum and maximum code frequency of all nodes shown and then divides the difference between these two values in seven equal value ranges. The smallest value range is assigned the smallest symbol and the largest value range, the largest. By collapsing or revealing codes, you may change the smallest or largest value, and the overall display therefore may change as well. When all the numerical values are identical, a mid-size square will be displayed.
If the Calculation of symbol size refers to the column/row option is selected, this mechanism is applied individually to the column or row.
The document segments that have been assigned a particular code can be called up immediately by double-clicking on the symbol. The relevant document and code are then activated and the coded segments appear in the “Retrieved Segments” window. It is possible to keep the CMB open, allowing one to easily view the contents of different symbols.
The Export
![]() symbol in the toolbar
allows you to export the Code Matrix Browser as currently displayed. This file
can later be inserted into a word processing program or Powerpoint slide.
symbol in the toolbar
allows you to export the Code Matrix Browser as currently displayed. This file
can later be inserted into a word processing program or Powerpoint slide.
Tip: Click on the camera
icon ![]() to copy the actual
view into the clipboard. Now you can open Word, PowerPoint, or other programs
and paste the image into it by choosing Ctrl+V
(Win) or cmd+V (Mac).
to copy the actual
view into the clipboard. Now you can open Word, PowerPoint, or other programs
and paste the image into it by choosing Ctrl+V
(Win) or cmd+V (Mac).