The MAXQDA 2022.2 update with a series of improvements, fixes and new features is here! This time we have dedicated ourselves to the Stats module and added significant improvements to make your research with MAXQDA even more enjoyable. Below are a few highlights of the latest update, but you are welcome to have a look at the complete list of improvements here or get a first impression of the main innovations in this short video.
How to upgrade to MAXQDA 2022
To upgrade a license from MAXQDA 2018 or 2020 to MAXQDA 2022, follow these three easy steps:
- Visit our online shop
- Navigate to the upgrade tab.
- Enter your license number to learn more about upgrade options.
You can quickly find your license number by clicking on the info icon in the upper left part of your MAXQDA start screen.
Elevate your Mixed Methods Research with Statistical Analysis
New Features for MAXQDA Stats
The Stats module is available in MAXQDA Analytics Pro. Use Stats to seamlessly quantify your qualitative data and enrich your analysis with additional insights. Statistically analyze qualitative data and document variables in MAXQDA – or import and connect your data with data sets in the Excel or SAV format (for example from SPSS or Stata.)
- Interactivity: Extended interactivity to connect results from statistical analysis with your qualitative data. Use selected cases from table outputs as filters in the Data Editor for in-depth analysis of sub-samples, such as extreme cases and outliers.
- Compute New Variable: Compute new variables based on code distribution. You can mix code frequencies and variable values while computing new variables using standard mathematical operators.
- Frequencies, Descriptive Statistics, Crosstabs: Extended analysis options for codes. Binarize codes and/or subcodes to analyze code existence instead of code frequency. Sum up subcodes.
- Descriptive Statistics: Split results tables by codes or variables to compare groups.
- Compare Groups – New Tests:
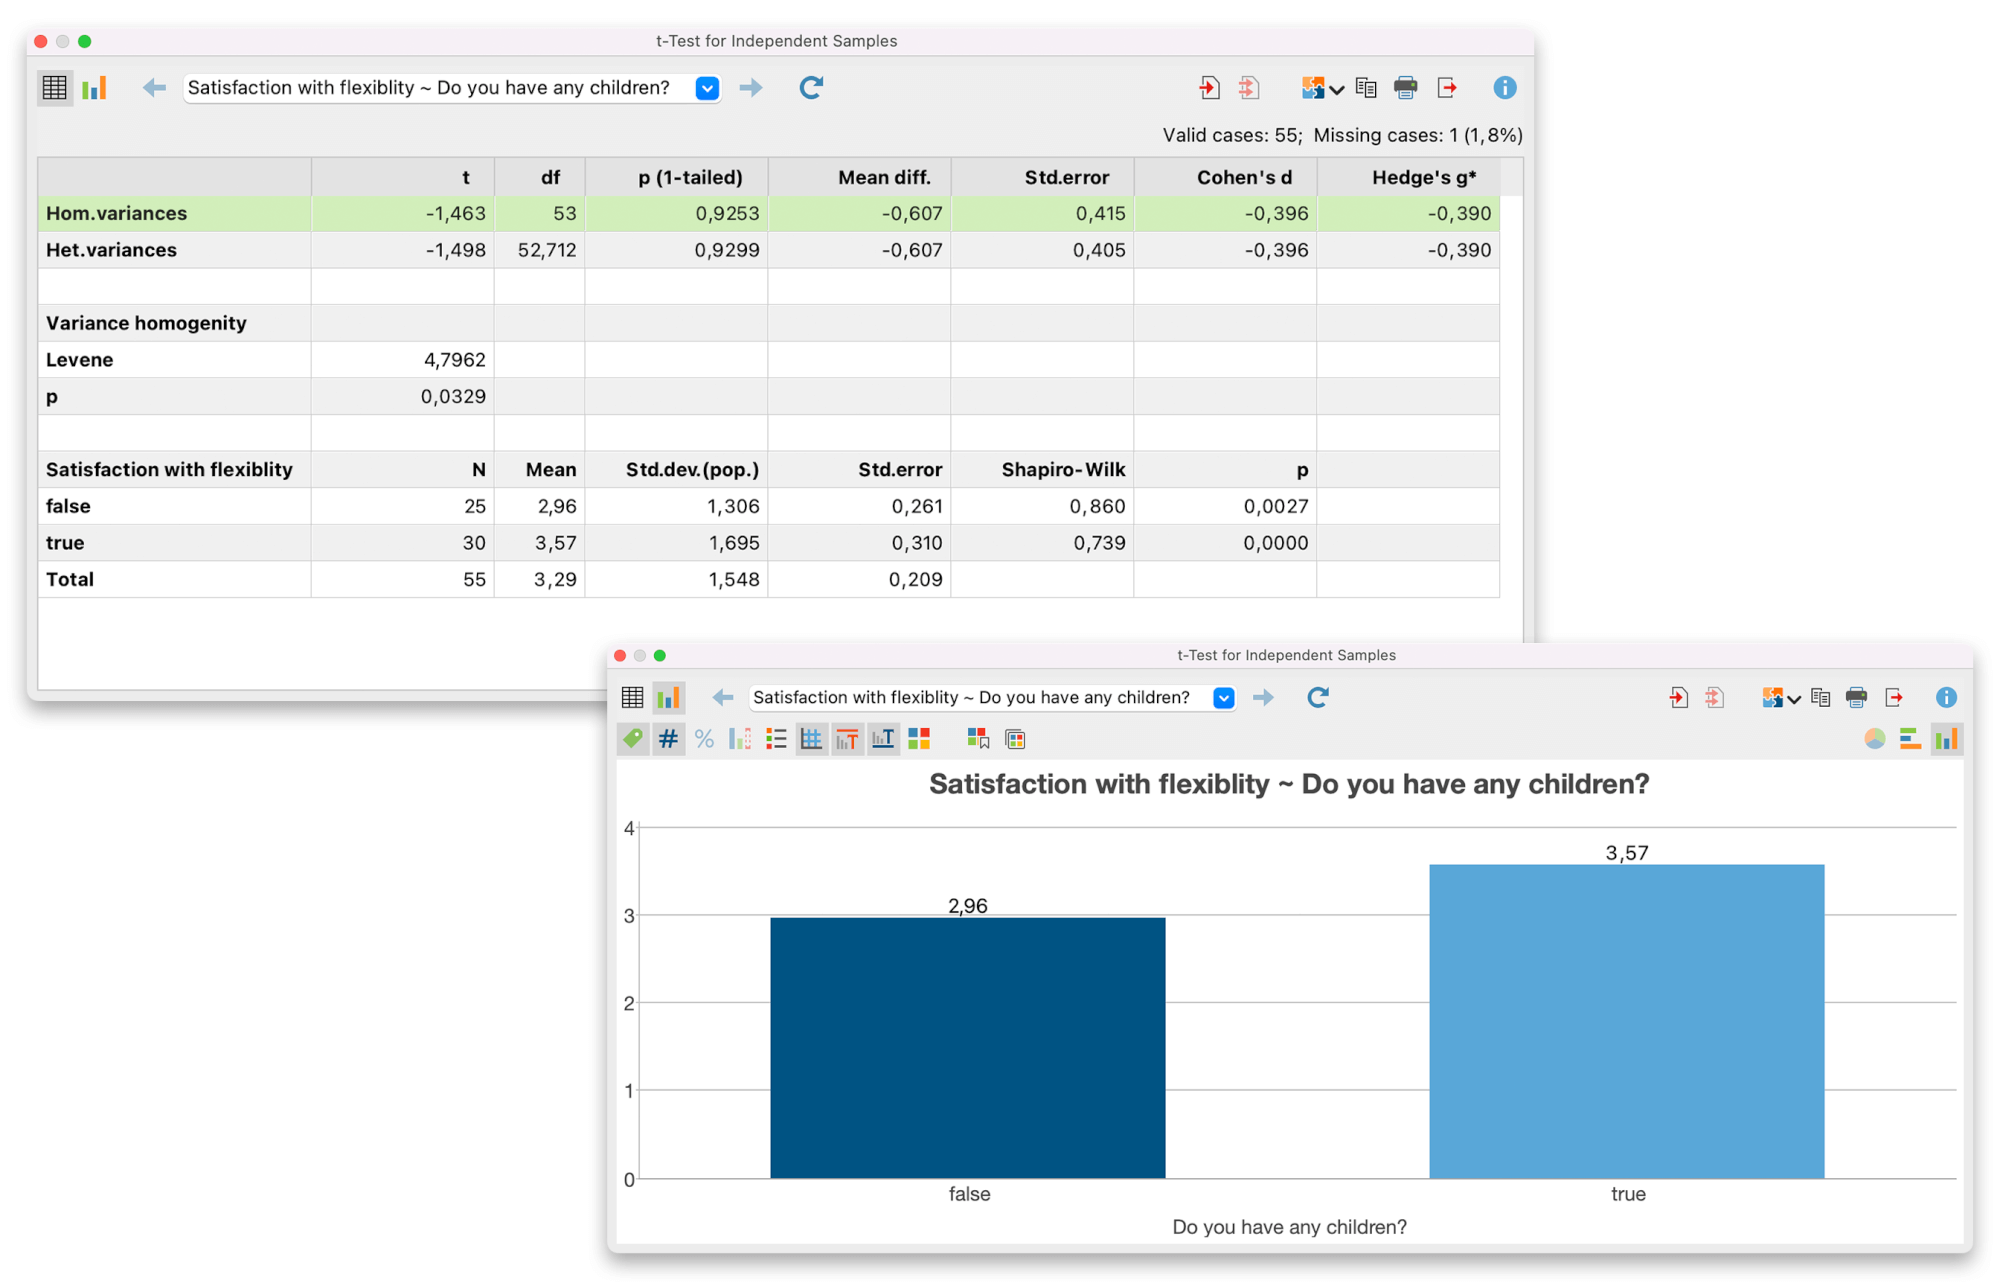
- t-Test for Independent Samples, including the test of normal distribution with Shapiro-Wilk, and effect sizes Cohen’s d and Hedges’ g.
- Mann-Whitney U-Test for Independent Samples

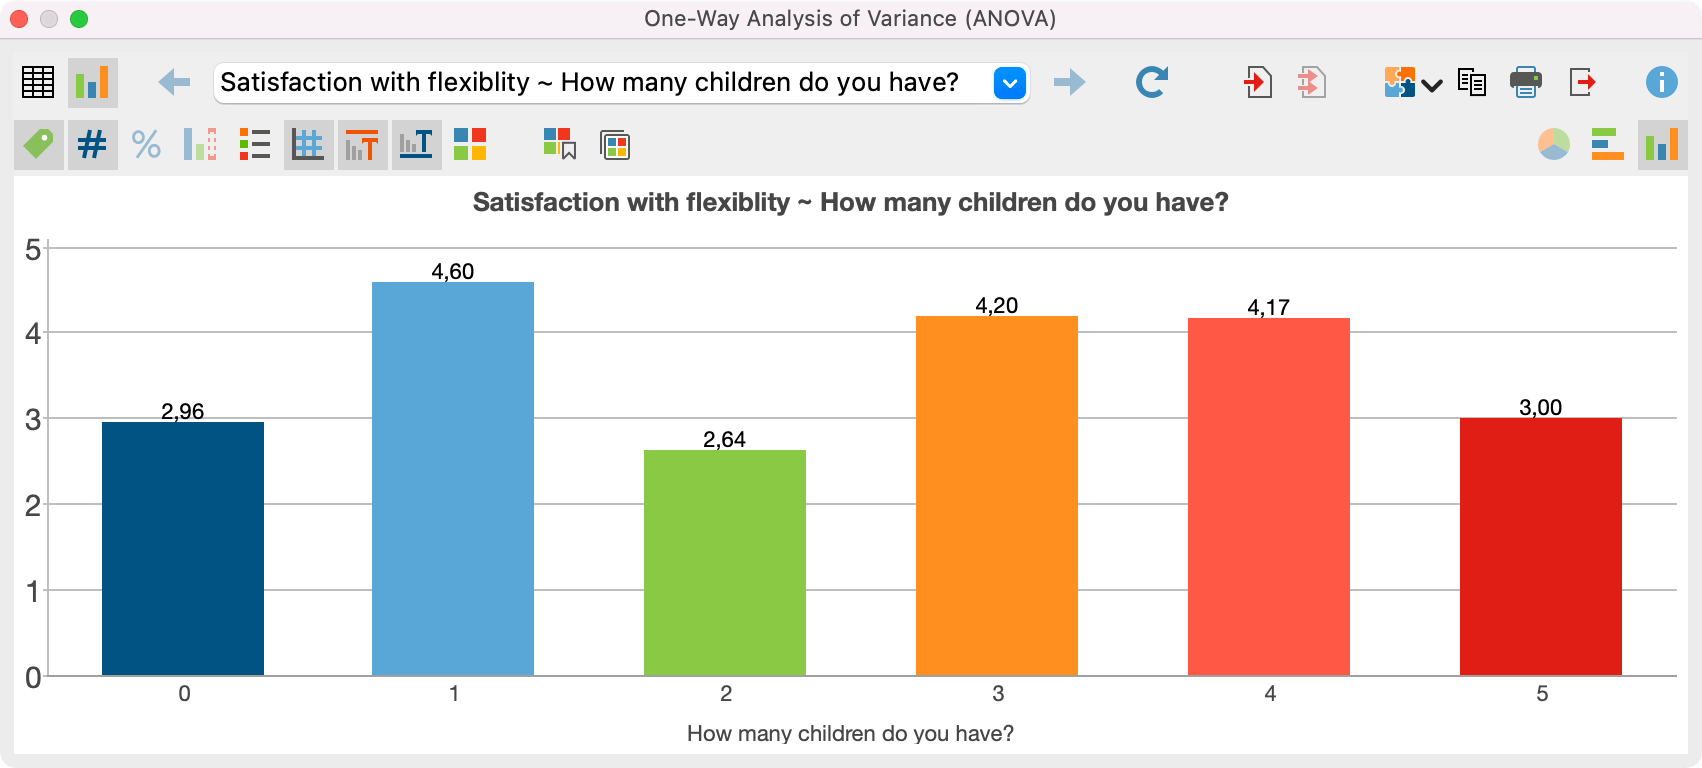
- Analysis of Variance: Identify relevant differences of mean values with Scheffe post-hoc test and effect sizes Cohen’s d and Hedge’s g.
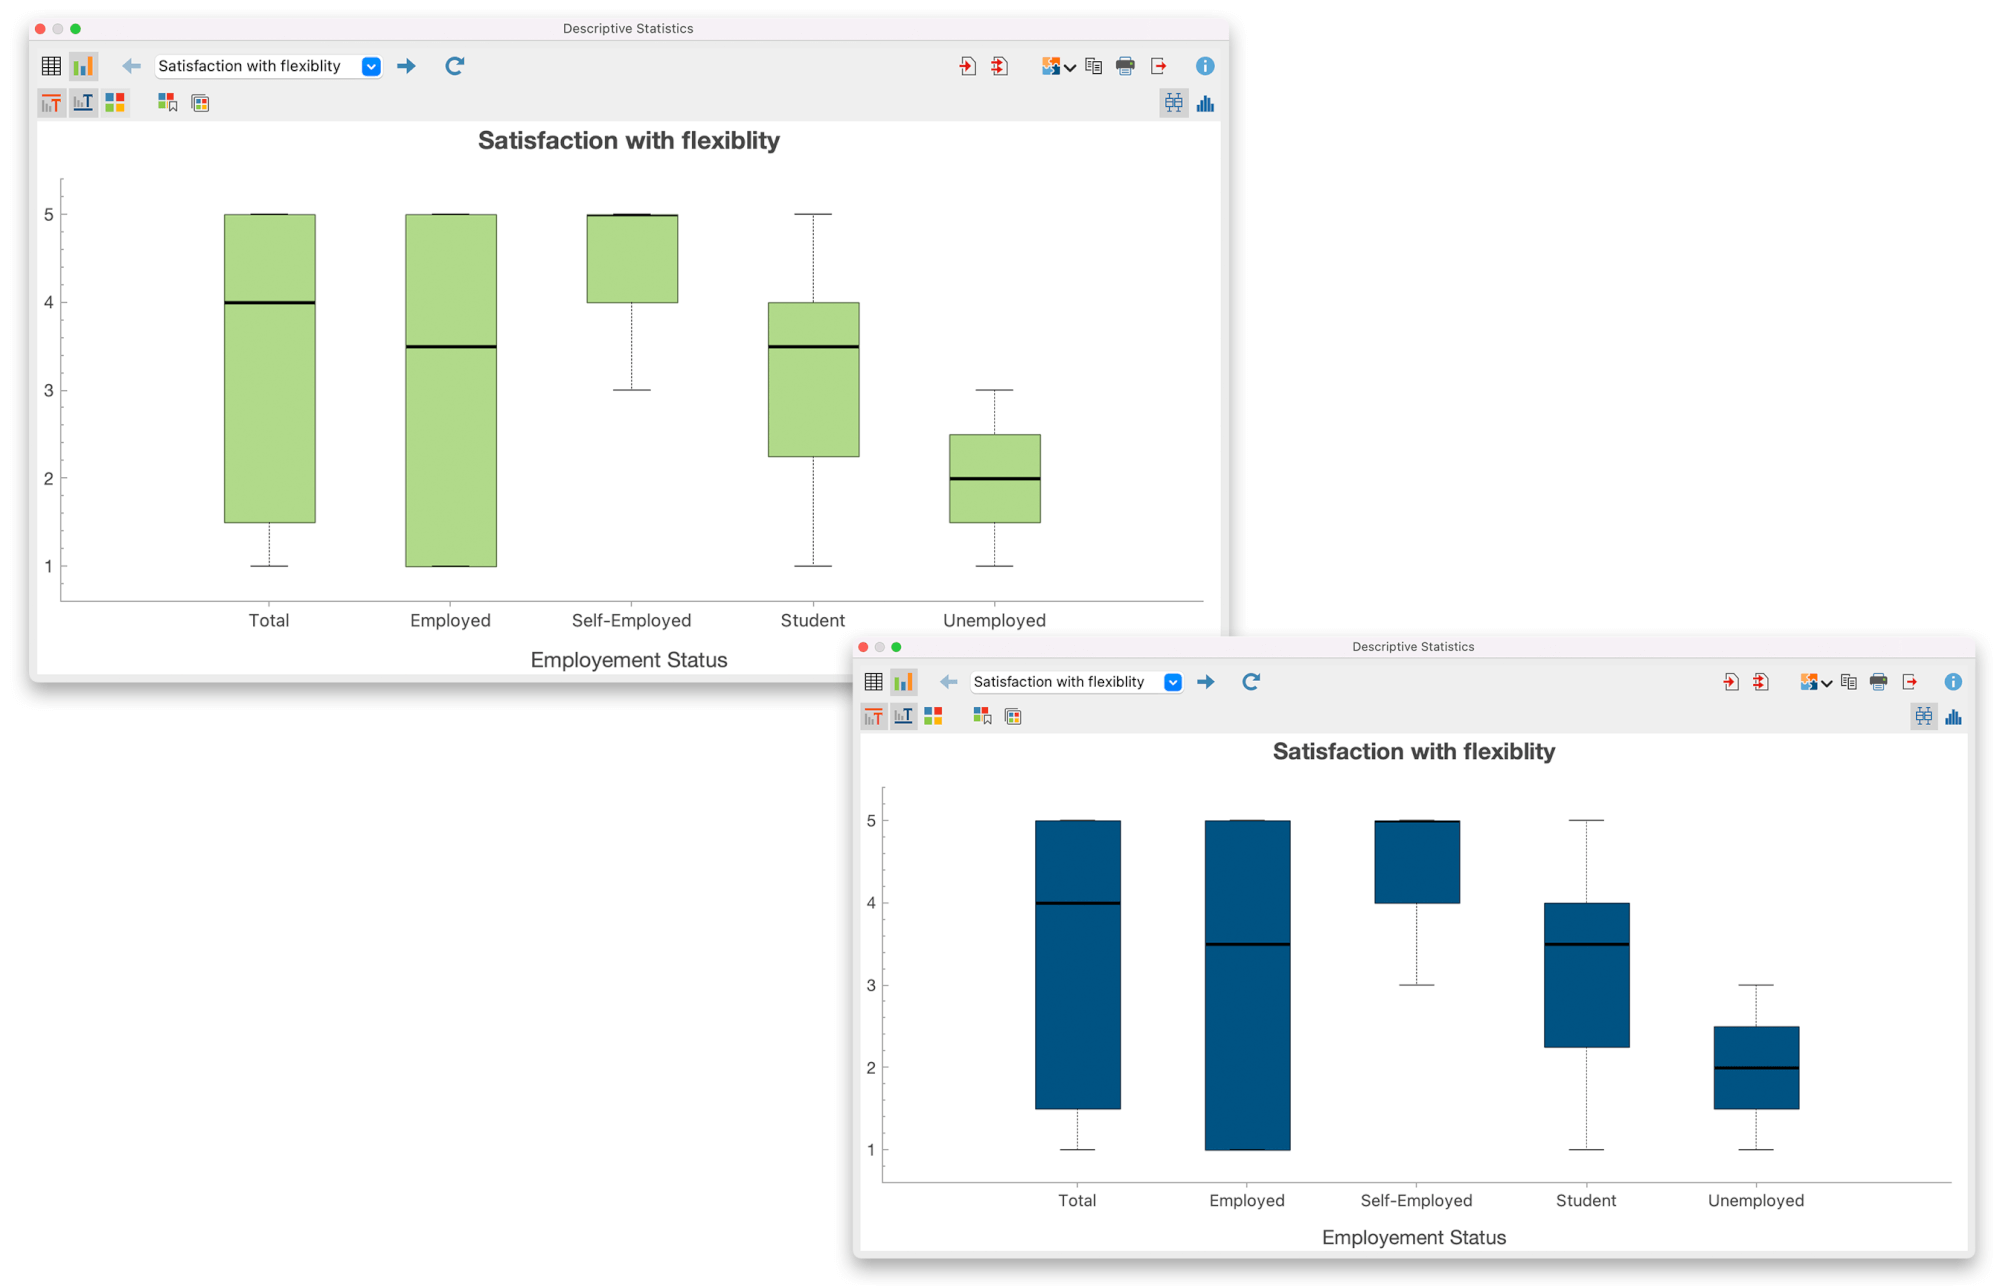
- Boxplots: Extended boxplot visualization. You can now display boxplots for multiple groups at once to compare distributions.
- Correlation: Extended option to customize correlation tables. Highlight cells by correlations or by p values. Display or hide statistical significance (p) and/or number of cases (N).
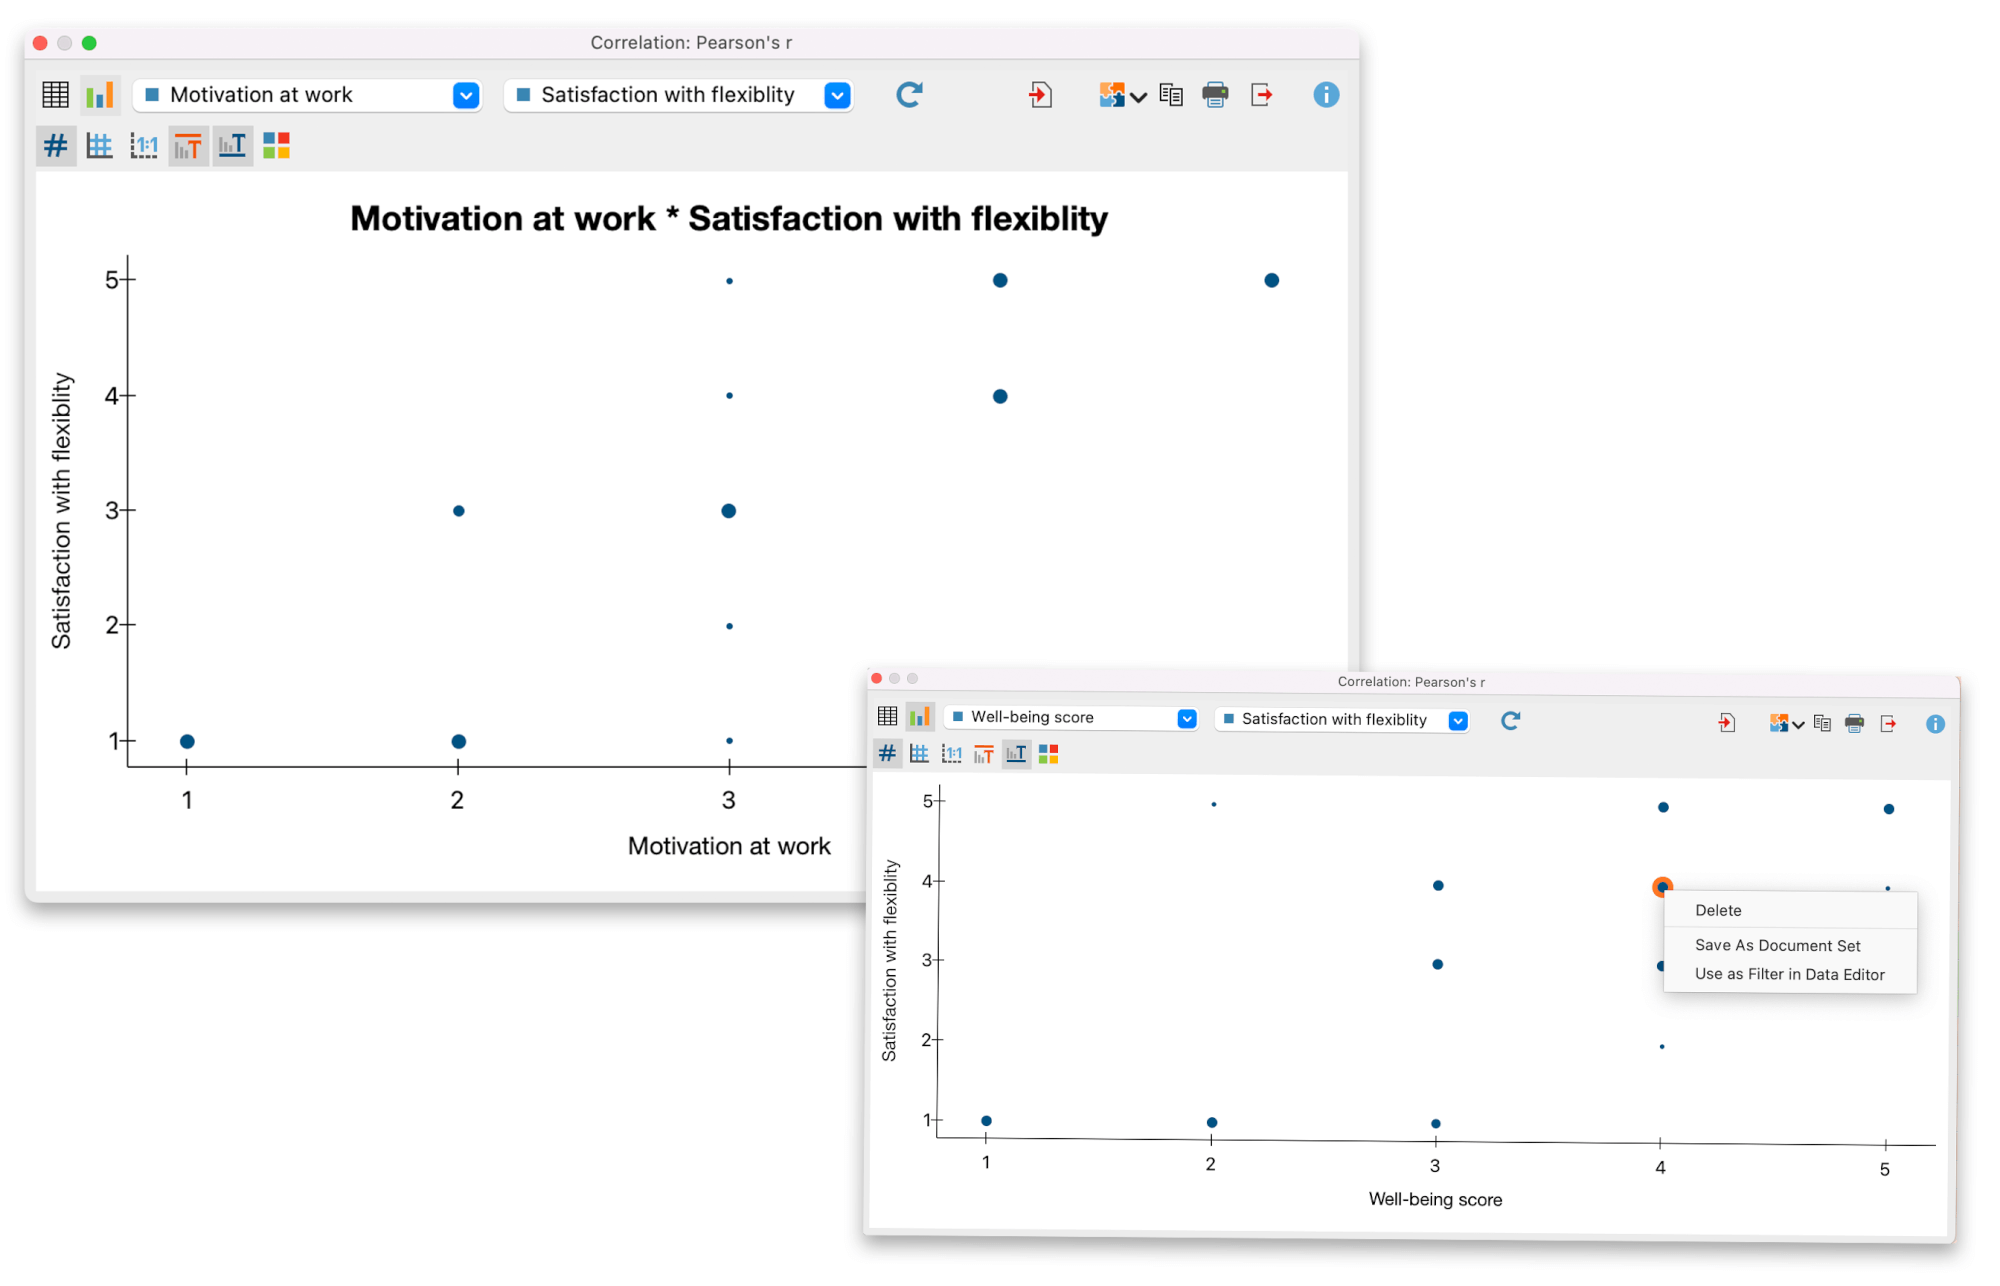
- Scatterplots: Extended interactivity in scatterplot visualizations. Select cases directly in the visualization to remove cases or to save any group of cases as a Data Editor filter or a MAXQDA Document Set.
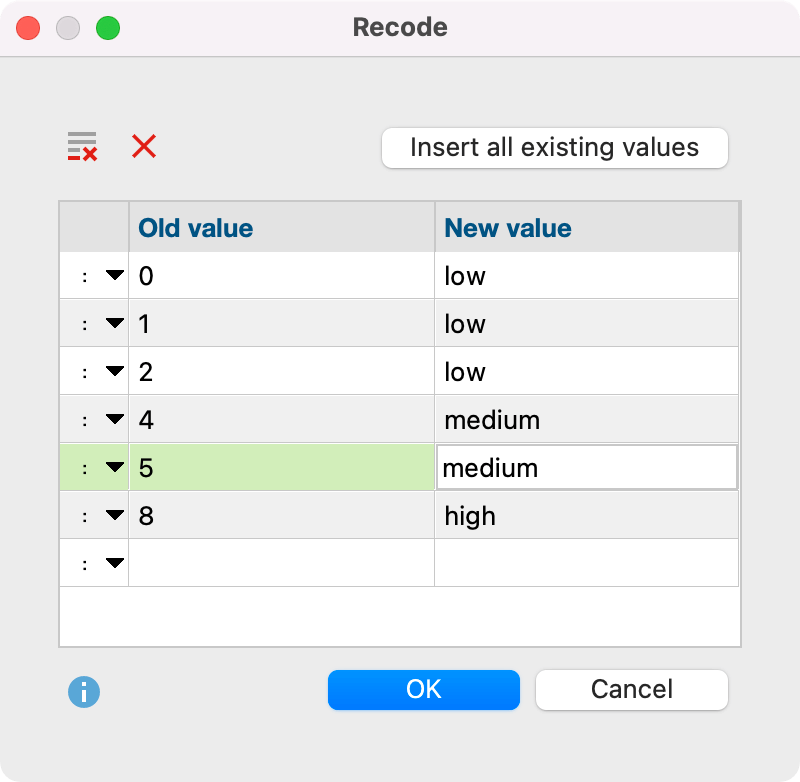
Recode Variables
Frequencies Histogram
And that was not all! Here are some more improvements:
- Document Map for Focus Group Speakers: Analyze similarities in comments from focus group participants in the Document Map for Focus Group Speakers. The Document Map places speakers close or father apart on the Map depending on their code assignments and speaker variables.
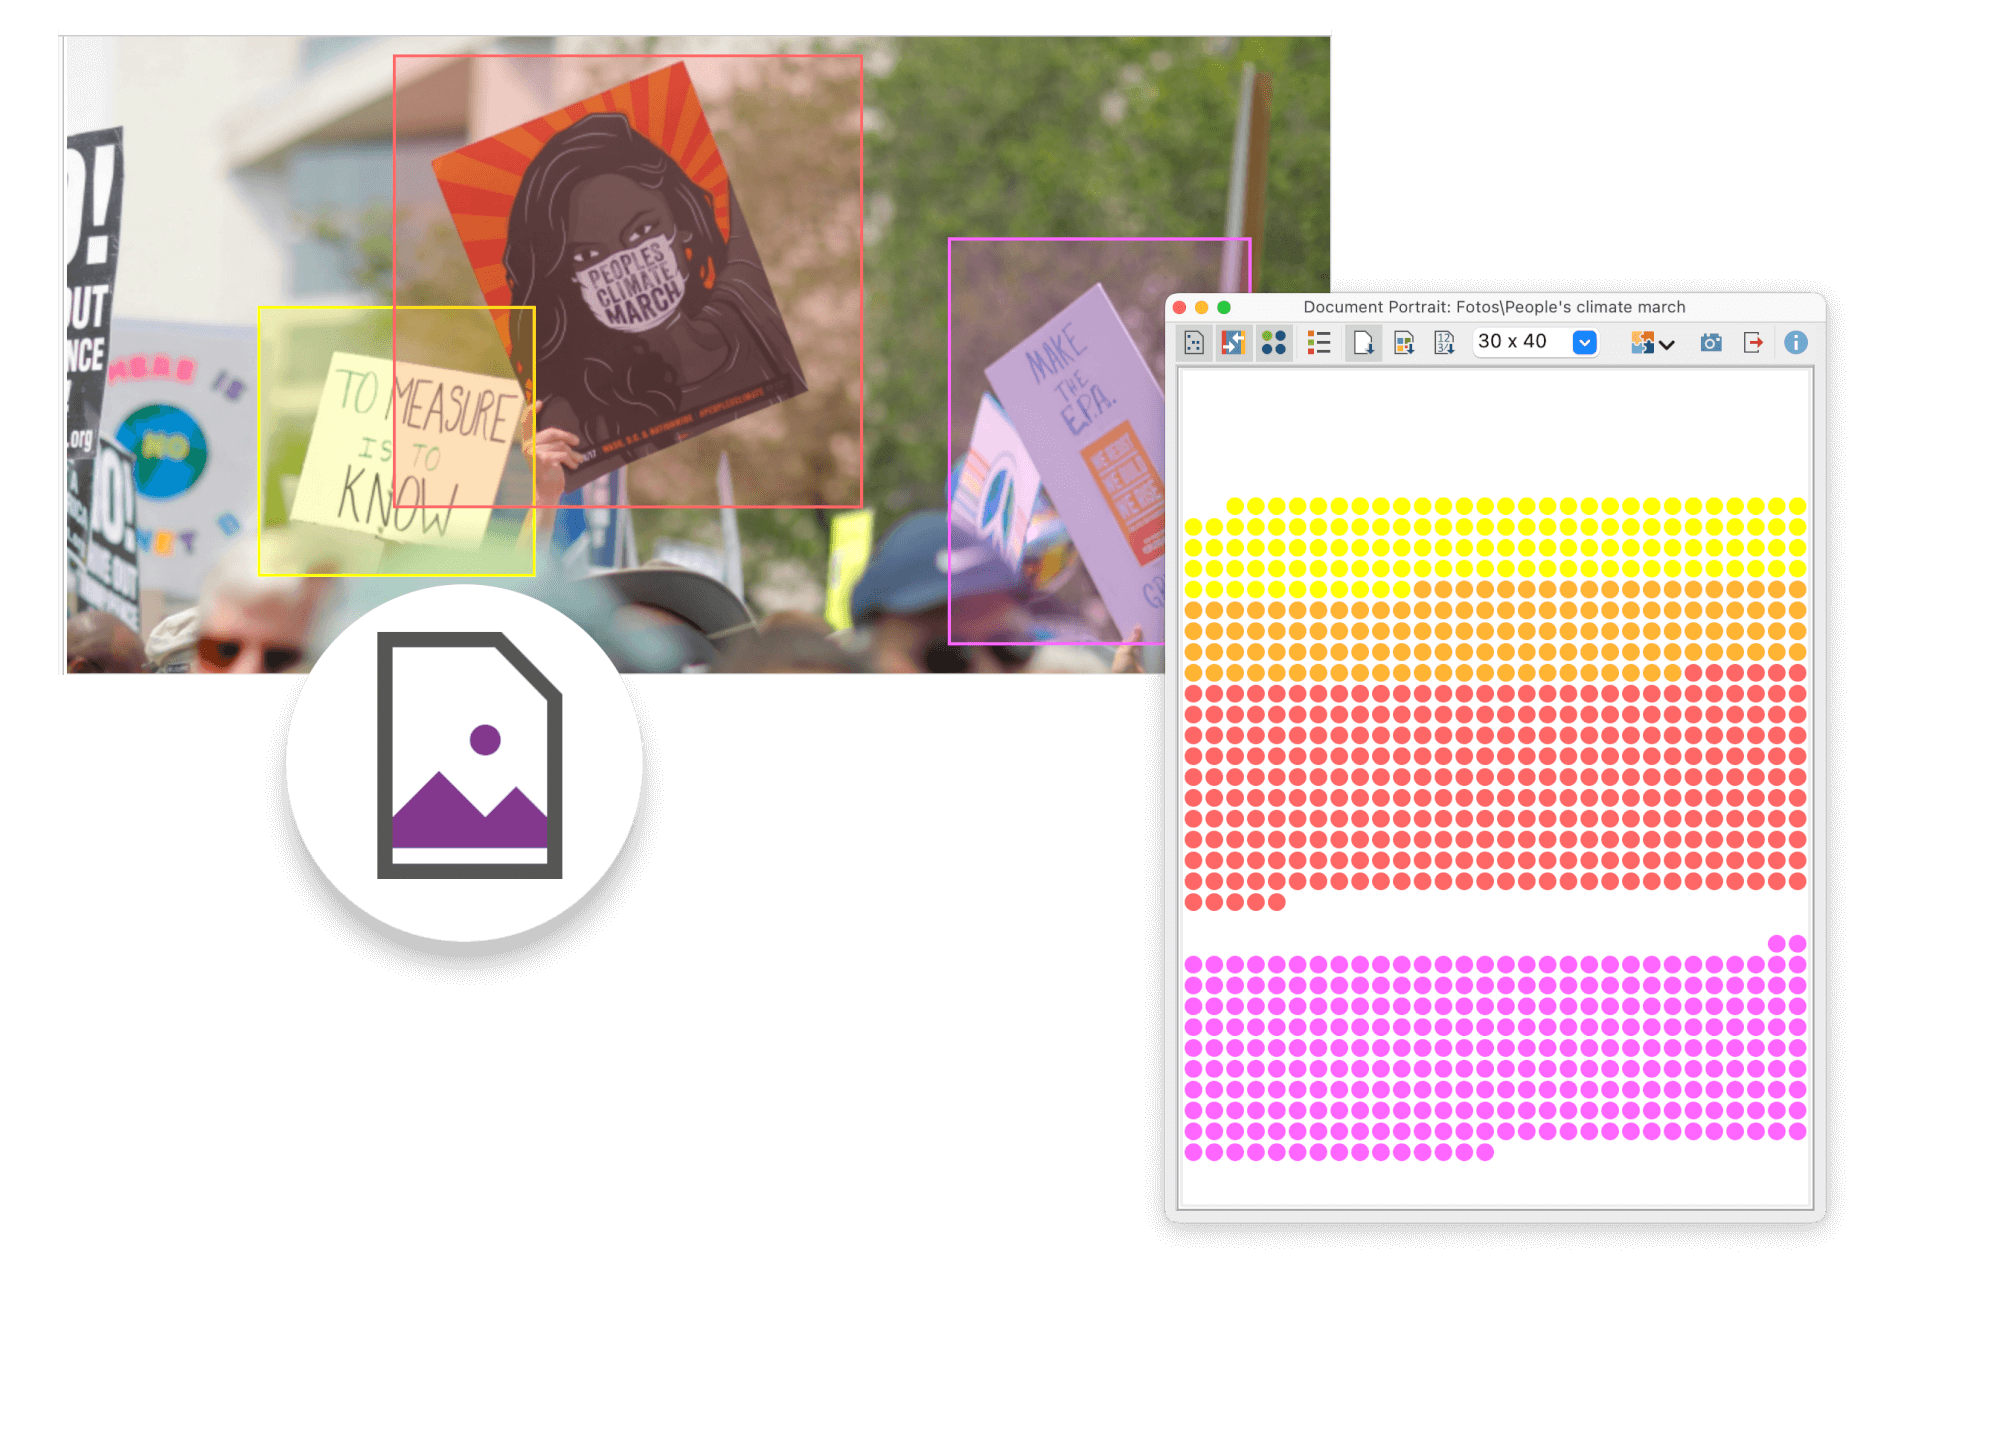
- Document Portrait for Images: The Document Portrait used to be limited to text, tables, and PDF documents. Now you can now create a Document Portrait for images as well.
Document Portrait
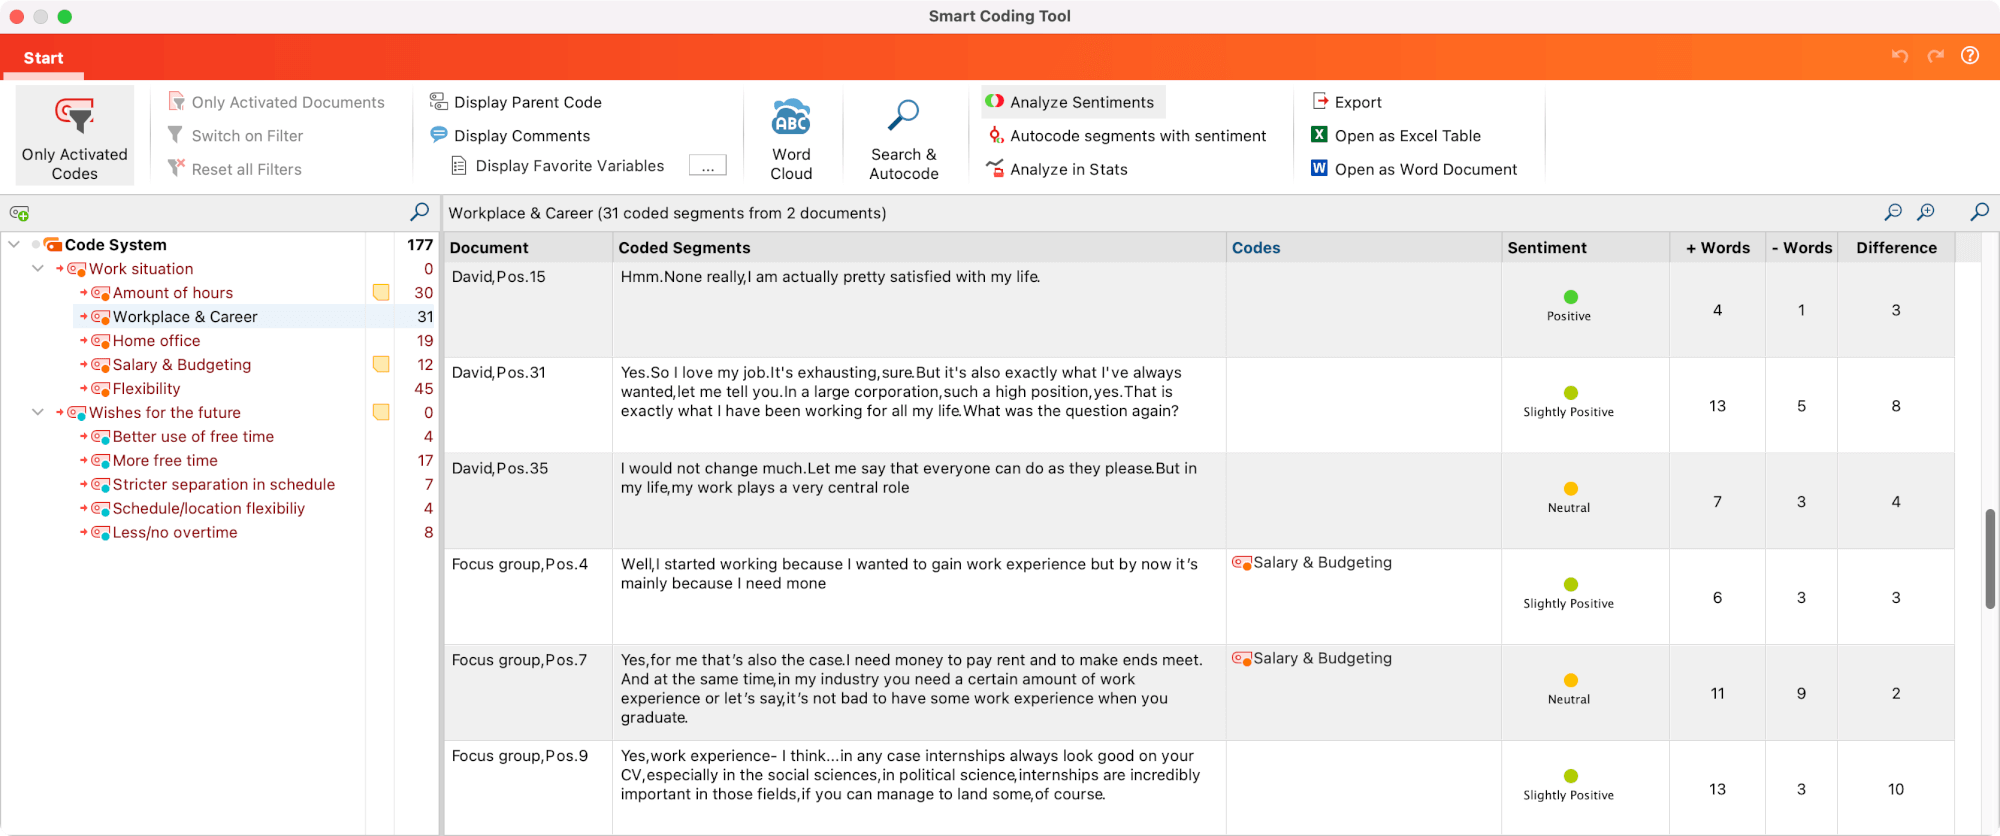
- Sentiment Analysis added to the Smart Coding Tool: Analyze coded segments within the smart coding tool by their sentiment and code segments with their sentiment scores.
- Highlighter in Memos and QTT Insights: Use the new text marker highlighting option to mark important passages in your memos or QTT insights in color.
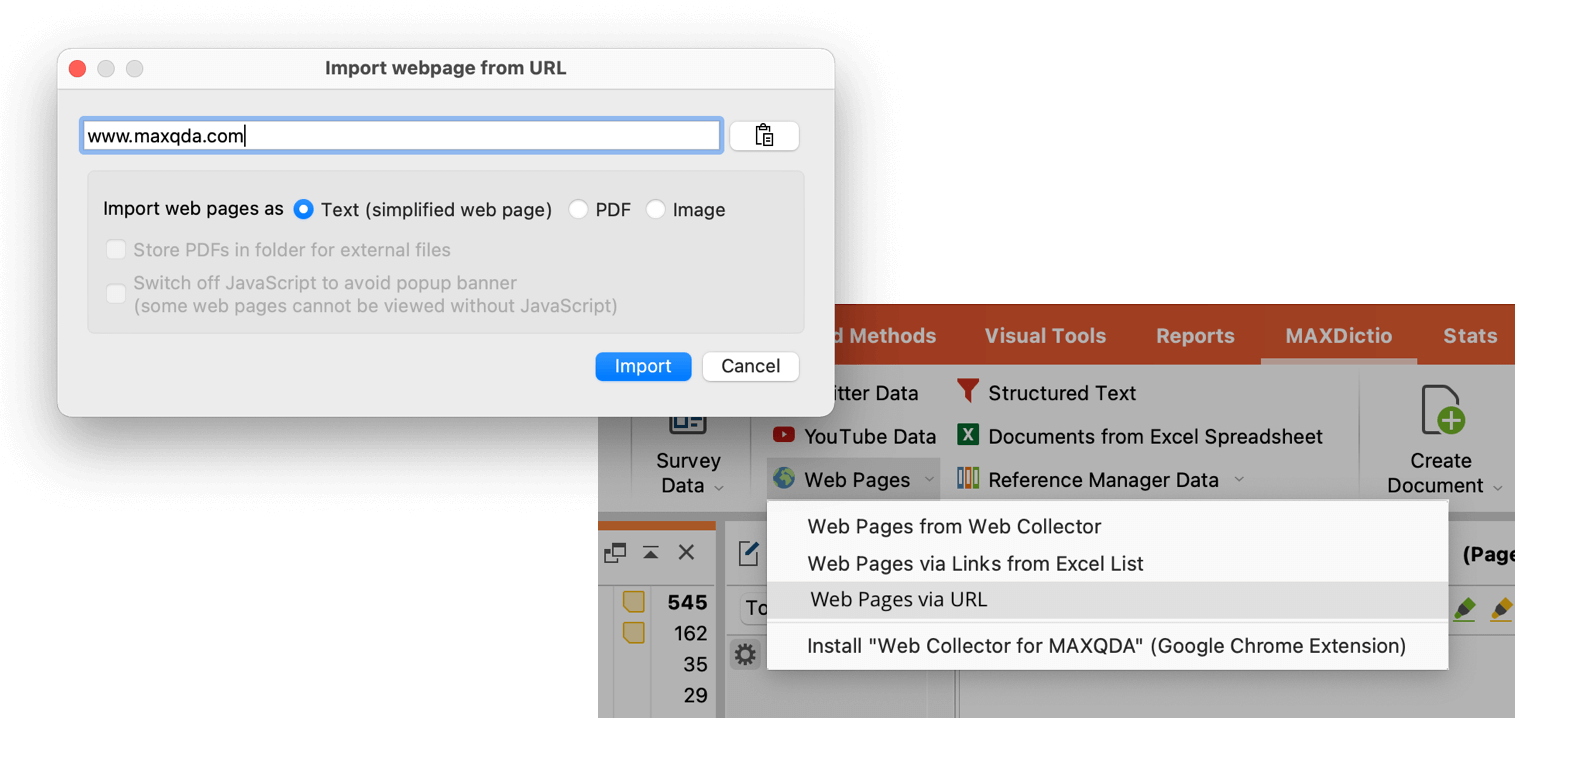
- Import one Webpage from URL: You were already able to collect webpages from inside your Browser with the free “MAXQDA Web Collector” – or import multiple webpages at once from a spreadsheet. With this new option you can just copy & paste the URL of a webpage and MAXQDA inserts it into your project as a new document.
- Improved workflow: Create multiple Document Portraits at once by selecting the documents and choosing “Document Portrait” from the right-click context menu. You can now also transform multiple PDF documents into Text documents at once.
- Document Comparison Chart for PDF documents: The Document Comparison Chart visually compares coded text for multiple documents at once. This feature used to be limited to text and table documents, but you can now use it to analyze PDF documents as well.
- Code Matrix Browser / Code Relations Browser: Quickly sort your code distribution or code relations visualization by frequency of a column with a click on the column header.

A complete overview of all new features and improvements can be found in the release notes. We hope you enjoy trying out our new features!