In my previous post, I shared the steps to analyse responses of local community members which were obtained through Focus Group Discussions. As a part of the same project I attempted to collect responses of school children on the subject of elephants. For this purpose I took the drawing method for data collection and sought assistance of MAXQDA 2020 for data analysis. The use of MAXQDA 2020 tremendously reduced the herculean task of hand-coding the drawings and analysing them.
I followed the following simple steps to analyse the received drawings from school students and arrive at my findings:
1. Import
I imported the drawings into MAXQDA 2020.
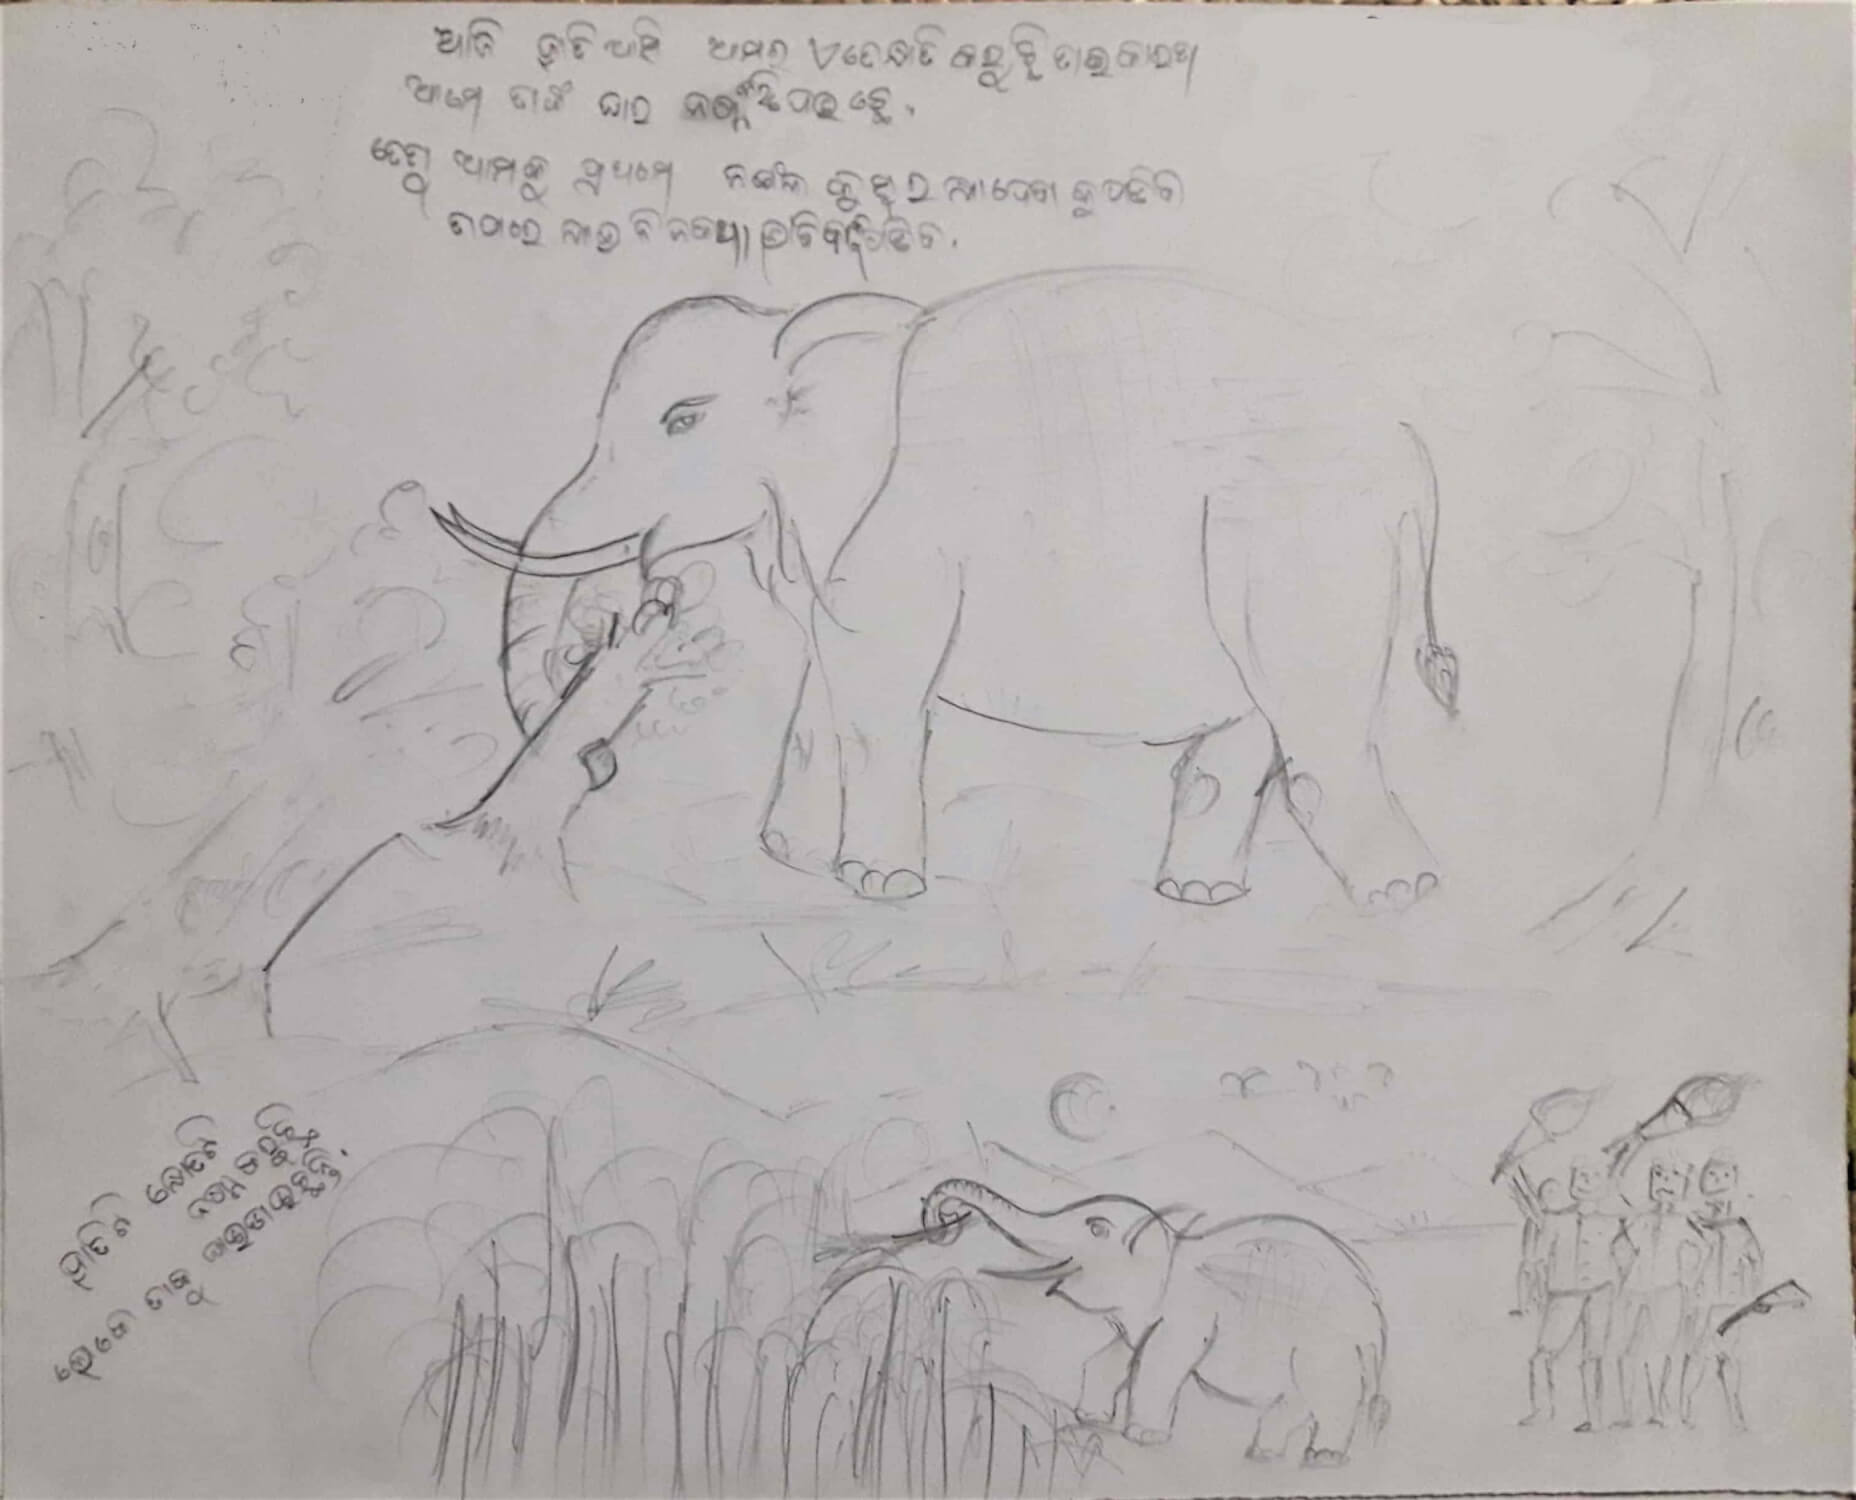 Figure 1: A drawing by a male student depicting various images of elephants that he has witnessed in his village.
2. Organize
After all the files appeared in the Document System window. I separated the drawings into two groups- i.e. male and female- in the Document System as I wanted to know if gender affected the perceptions among children. I also appropriately renamed the files with a unique identification number.
3. Code
I had not decided what codes I would like to find in the images, so with an open mind I started coding the drawings looking for different themes and narratives. I selected an area in the image, named and colour coded them. I repeated the process until I had satisfactorily included all the elements in the drawing. The list of codes formed the code system which added clarity and gave direction to the research. In total there were five codes (themes) that emerged from the process of coding. For the purpose of this blog I have used examples of one code, i.e. “manifestations of conflict” which filled a major portion of the drawings.
4. Add Memo
While taking a closer look at the pictures and coding, I noted all the passing thoughts and notes in memo sheets. I attached memos to codes and made independent memos as well.
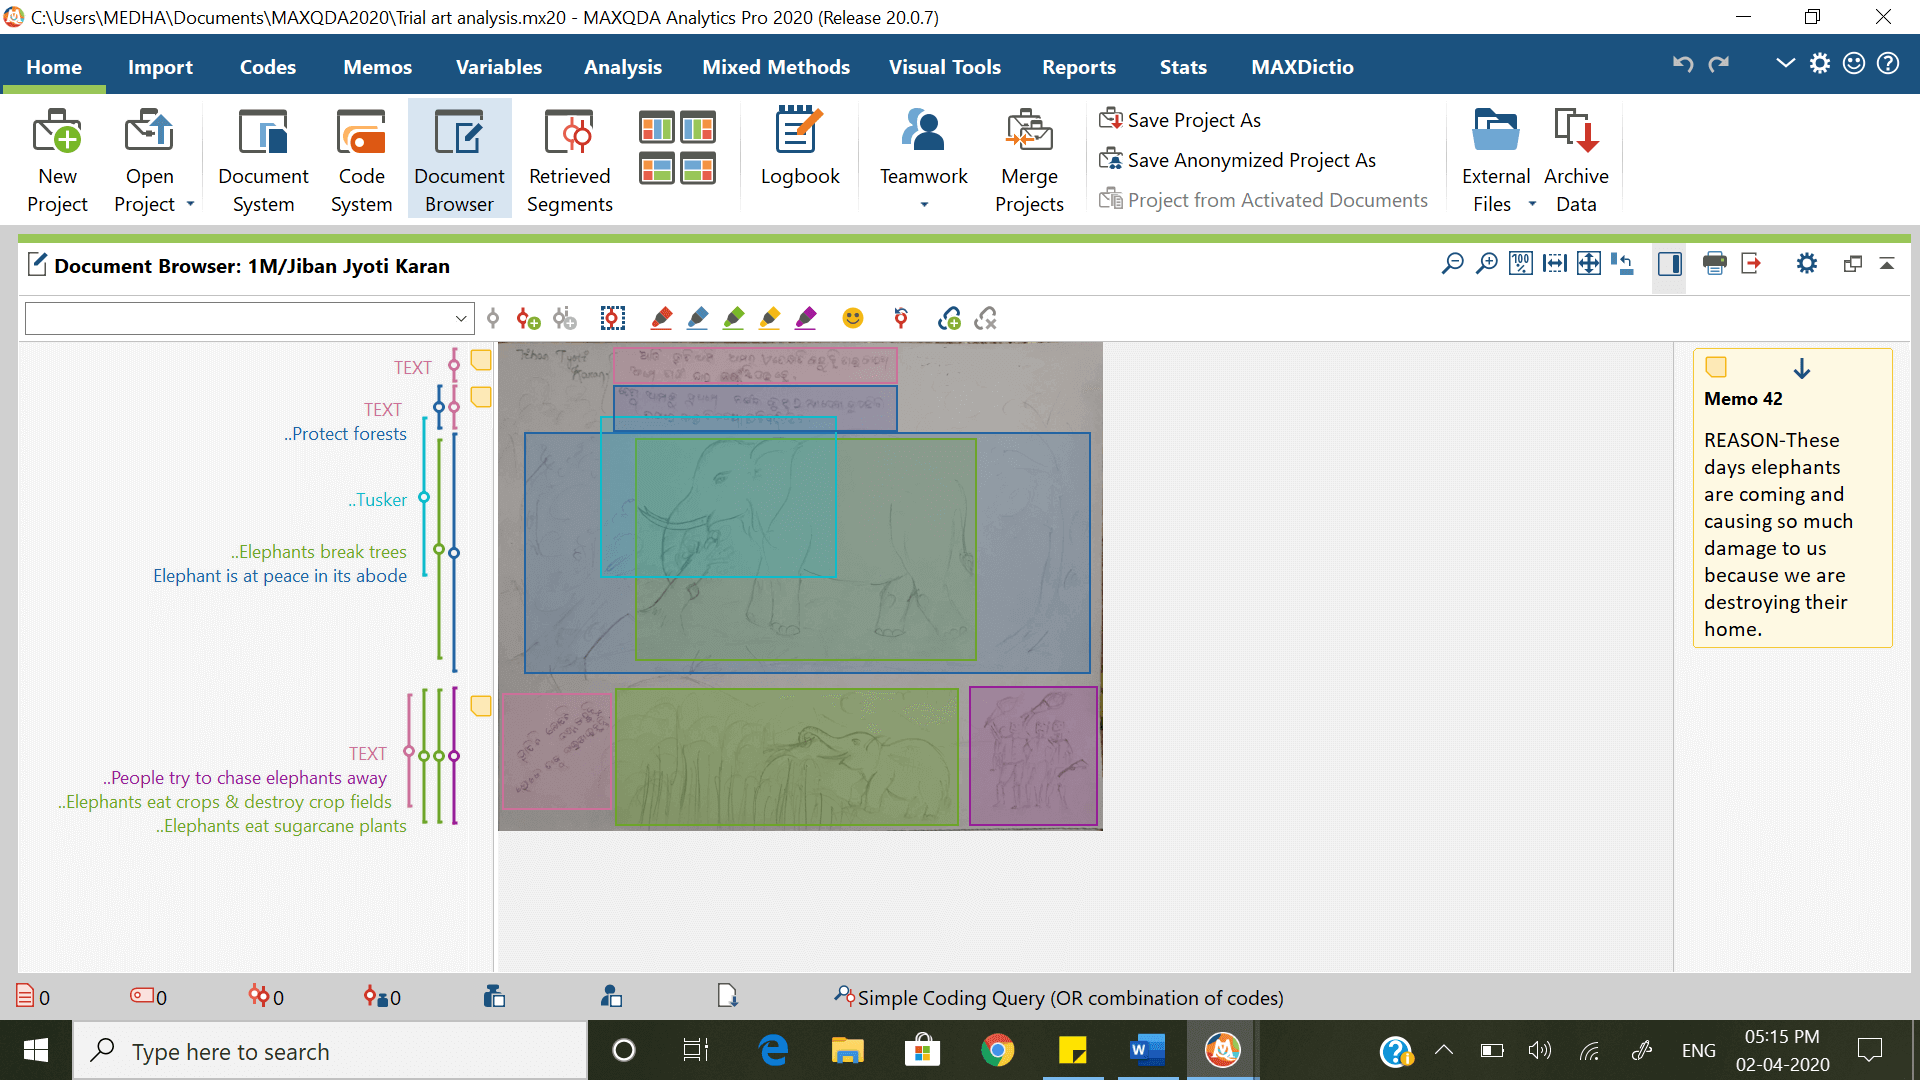 Figure 2: The drawing from Figure 1 has been successfully imported and coded. The codes appear to the left of the drawing and the memo is on the right.
5. Retrieve coded image segments
I activated the drawings from the Document System and codes from the code system to have an overview of the retrieved segments. I followed this process to check if all the drawings were coded and made adjustments/modifications wherever required.
6. Export retrieved segments
I exported retrieved segments in MS Excel format. Instead of simply reading the codes I had the images alongside to verify the codes and appreciate the variety in depictions. For instance, “manifestations of conflict” had several pictures of elephants damaging houses and eating paddy crops and other plants. During this exercise it is also possible to find how much space or area is covered by code in the drawings that are being analysed.
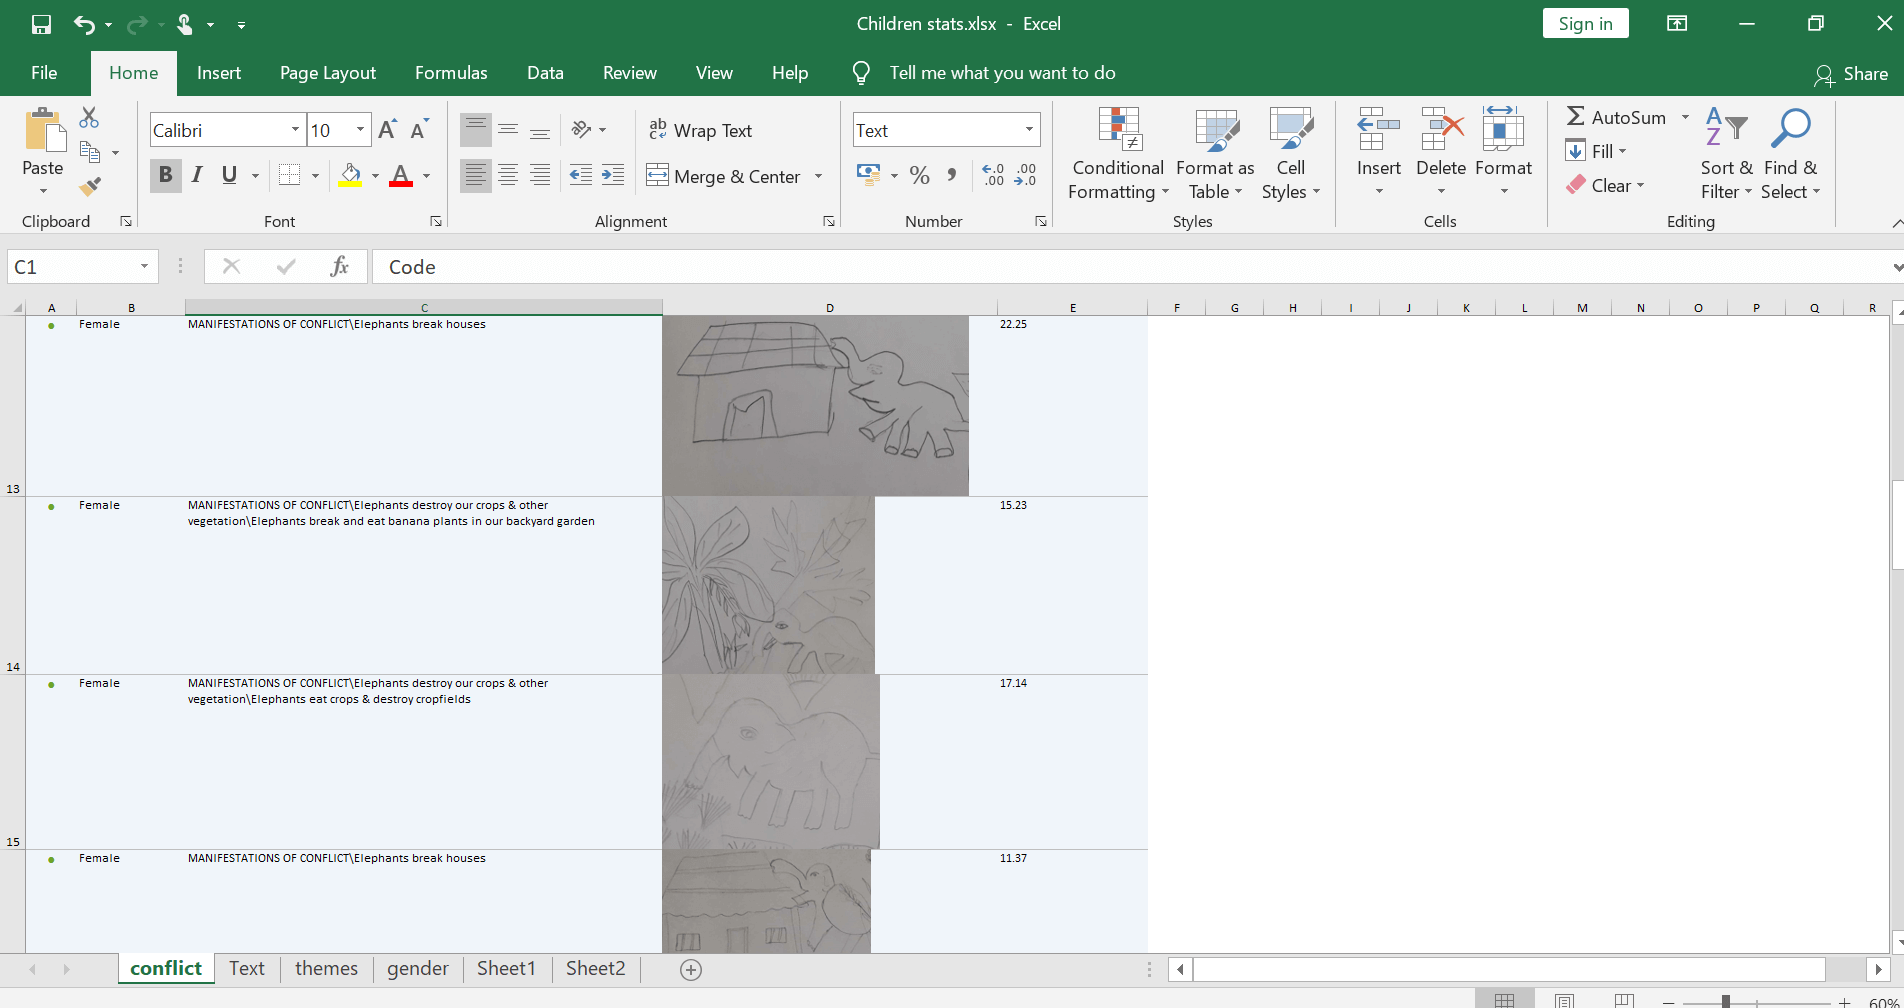 Figure 3: The screenshot shows the retrieved segments which were exported to MS Excel. The images show the portions of drawings coded as manifestations of conflict.
Figure 3: The screenshot shows the retrieved segments which were exported to MS Excel. The images show the portions of drawings coded as manifestations of conflict.
7. Analyse
The code system provided an overview of emergent themes and patterns but to gain more insights I used other analysis options.
a) Cross Tabs
I used the cross tabs option to compare the responses of male and female participants across the themes they discussed. Elephants destroying crops and vegetation was most often mentioned, which had sub-categories like elephants eat crops, banana plants, sugarcane plants, palm trees, etc. Five participants showed elephants breaking banana plants, and two male students showed them feeding on sugarcane plants. The proportion of female students mentioning crop damage was higher (69.2%) than male students. Damaging houses were noted in thirteen drawings, mostly (69.2% (9/13*100)) represented by the male students.
 Figure 4: This screenshot shows that there were 15 females and 19 males who took part in the study. Among them most of them pictured elephants eating crops and destroying crop fields.
b) Code Matrix Browser
Similarly, I also used the Code Matrix browser for comparison of themes across the gender of the participants. The Code Matrix browser depicts the same results as the Cross Tabs option but in a different format. Clearly, the male participants presented six themes while the females depicted only four, and comparatively less themes overall. The discussed manifestations of conflict are of three types: destruction of crops and vegetation, breaking houses and injuring/killing humans. There are five sub-categories of crop damage that were found from the drawings as shown in Figure 5.
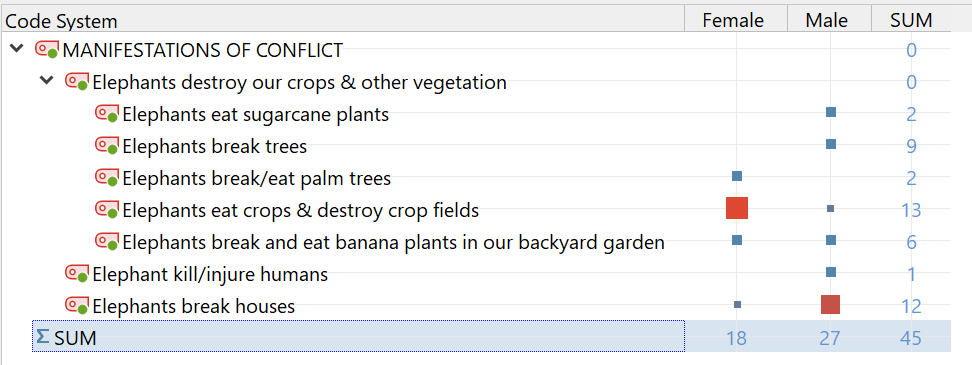 Figure 5: Screenshot of Code Matrix browser representing the code ‘Manifestations of Conflict’ and its occurrences across gender.
8. Illustrate concepts
Another way to depict the same result is to use MAXMaps. I used MAXMaps in Visual Tools to present an illustrative diagram of Manifestations of Conflict or Problems due to Elephants. I used MAXQDA’s Code-Subcodes-Segments Model to form an illustrative diagram. I further used my imagination and creativity for more meaningful representation.
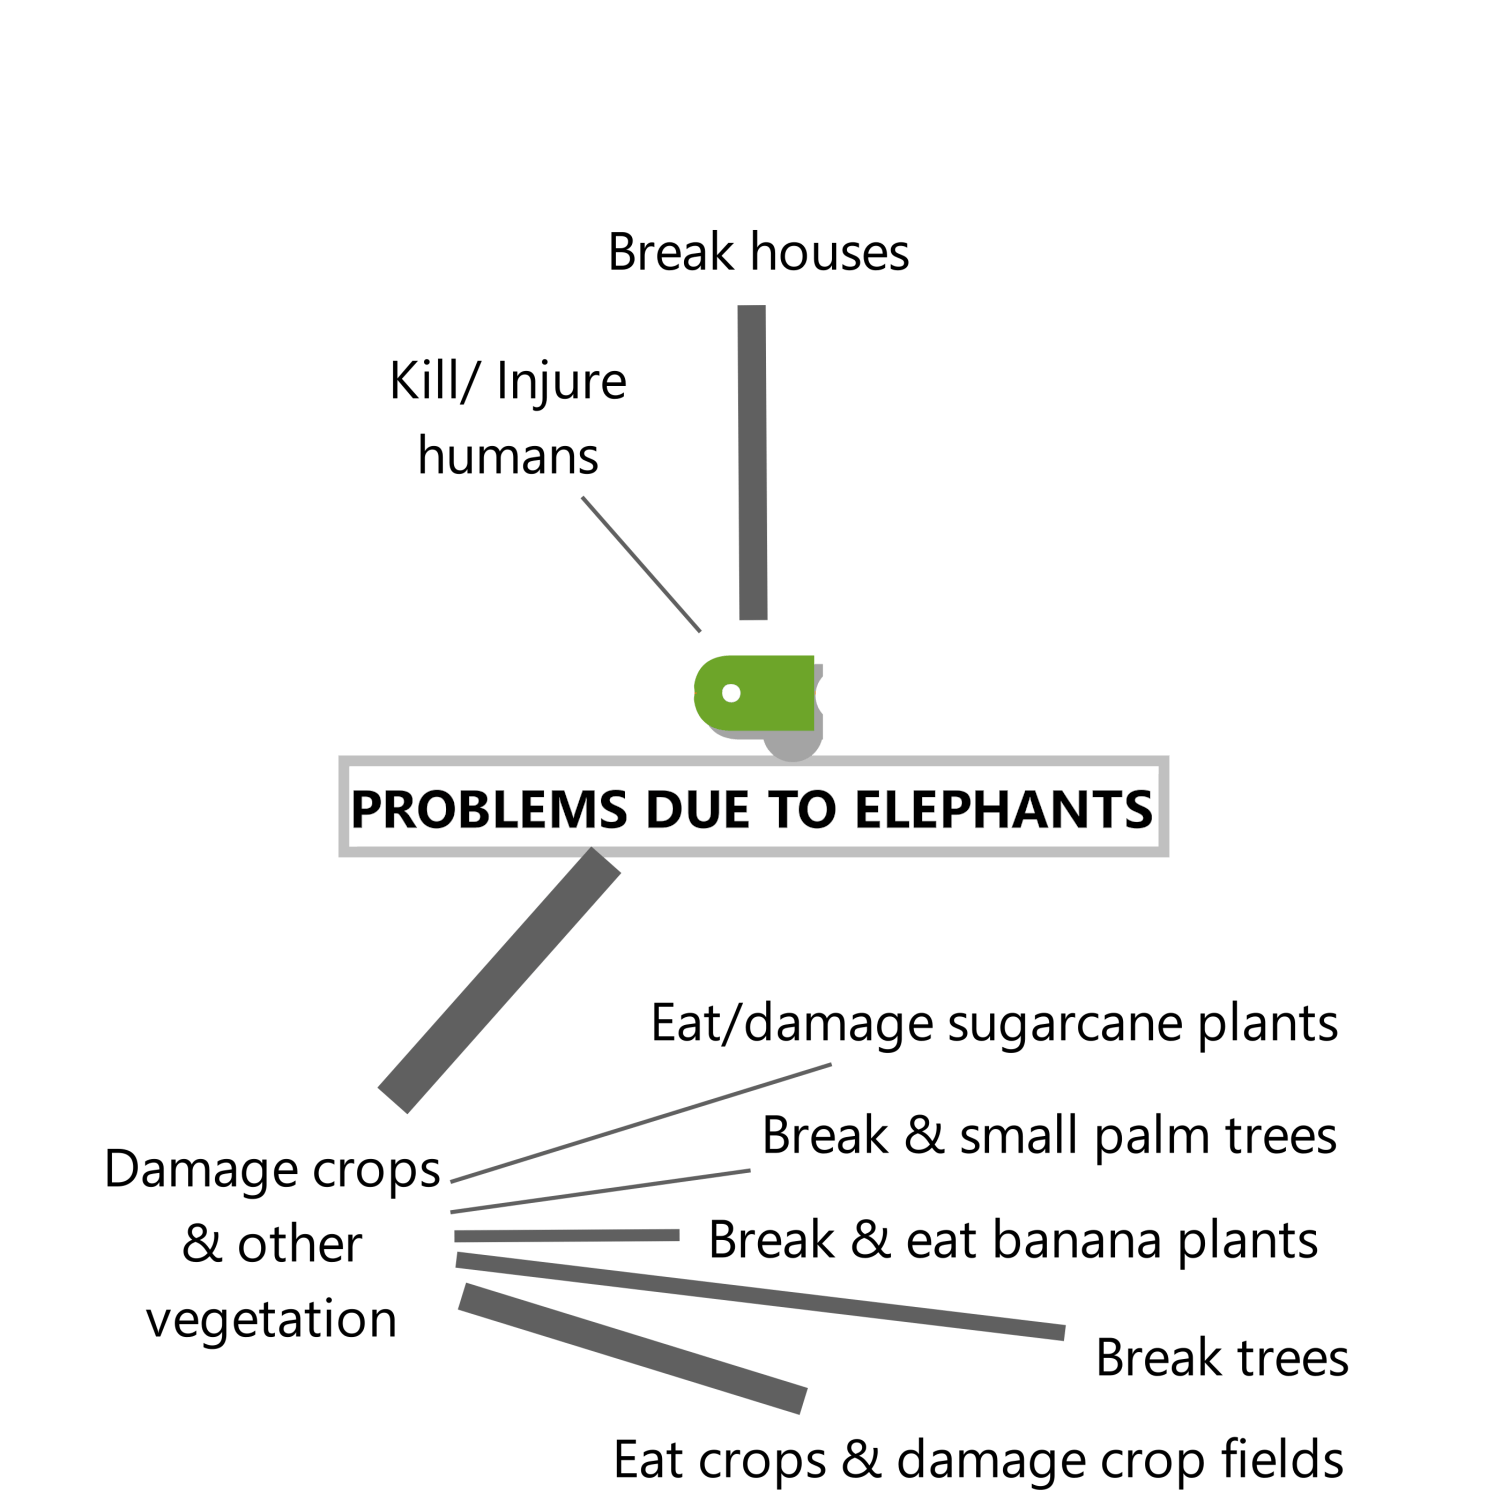 Figure 6: Problems due to elephants. The illustrative diagram is made using MAXMaps where the codes and sub-codes are mentioned. The thickness of the lines represents their frequency.
Findings
The children’s drawings depicted most forms of human-elephant conflict and their vulnerabilities towards the elephants. This conflict seems to have left a lasting impression on their minds. The male participants were found to present more varied ideas than their female counterparts. The overall findings of the study emphasized that conservationists need to work not only towards mitigation mechanisms but also improve awareness among children who are the future stakeholders of human-wildlife conflict and conservation.
Image Documents in the MAXQDA2020 Manual
About the Author
Medha Nayak is a PhD candidate at National Institute of Science Education and Research-HBNI, Odisha, India, in their School of Humanities and Social Sciences. Her research project is titled “Understanding human and elephant interactions in northern Odisha”.

 Medha Nayak is a PhD candidate at National Institute of Science Education and Research-HBNI, Odisha, India, in their School of Humanities and Social Sciences. Her research project is titled “Understanding human and elephant interactions in northern Odisha”.